
Bromatological, analytical and chemometric assessment of animal and plant foods based on mineral composition


Abstract
There are several examples of numerous applications of analytical and multivariate techniques useful in investigations of varied assortment of food products. The successful use of chemometrics in study of food such as meat and its products, fish, seafood, milk and dairy products, honey, cereal products, oils, oilseeds and nuts, vegetables, fruits, mushrooms, tea, coffee, confectionary products, mineral waters and alcoholic beverages deserves attention. RDA indicated exceeded its normative values for Se, Cu, Mn, Fe and Cr in some groups of animal food and Cr, Mn, P and Fe in some assortment of plant food. Based on PTWI values for Pb, Cd and Hg, there is no threat to human health resulting from the consumption of the investigated food products. It is concluded that the proper use of analytical and chemometric tools is useful for assessing nutritive and health quality of animal and plant foods. They play an important role in quality control, and their classification in view of geographical origin, confection and degree of environmental pollution. Both, instrumental and multivariate techniques would be useable in differentiating unprocessed and technologically processed food as well as detecting fraud to preserve the brand name of the original product. The aim of this study is to give an overview of the crucial issues associated with the implementation of chemometrics in food research and development.
Citation
Szefer P, Grembecka M. Bromatological, analytical and chemometric assessment of animal and plant foods based on mineral composition. Eur J Transl Clin Med. 2022;5(1):77-106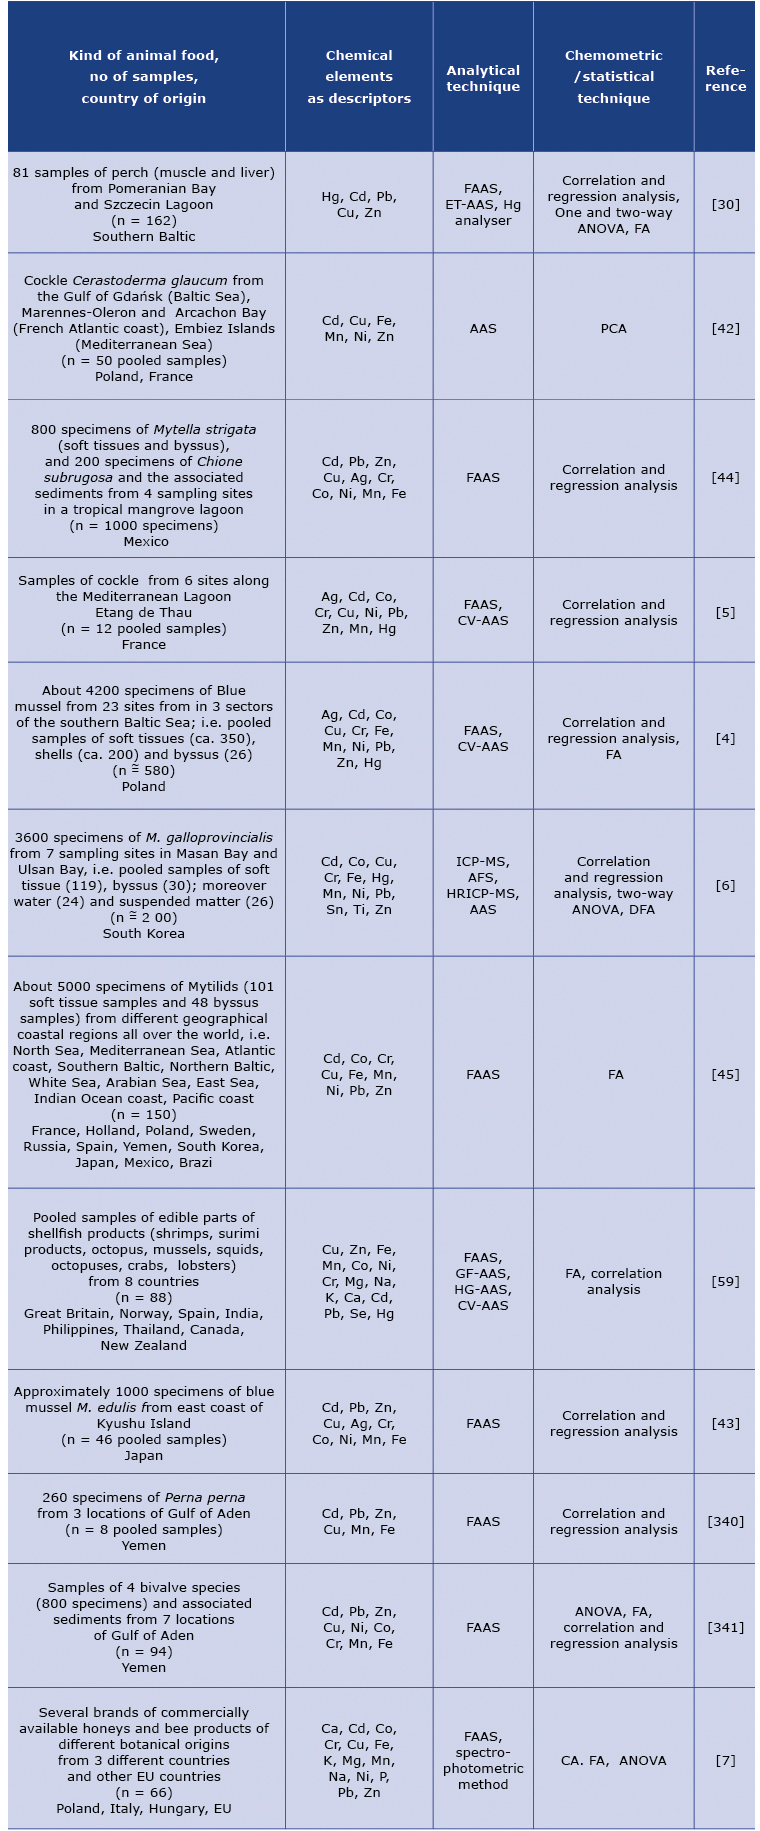


Introduction
In order to perform adequate analytical and chemometric assessment of original data it is important to use skillfully modern both analytical and computational tools following strictly the rules and research criteria. In recent times dynamic progress of analytical and chemometric techniques has been observed owing to new and advanced informative technologies. They make it possible to reliably obtain useful information from an experimental data set. Therefore, multivariate techniques appeared to be the key statistical and mathematical approach to explore extensive data base being highly helpful in simple and quick explorations as well as identification of similarity between samples (objects) and measured parameters (variables). The aim of this study is to give an overview of the crucial issues associated with the implementation of chemometrics in food research and development.
Material and methods
The Scopus, ScienceDirect, Medline and Web of Science databases were searched for literature published from 1989 to 2021 using the following keywords: Chemometric evaluation; Analytical evaluation; Food authenticity; Food adulteration; Meat; Fish flesh; Seafood; Milk and dairy products; Honey; Grain products, Olive oils and oilseeds; Vegetables and legume seeds; Mushrooms; Fruit and its products; Tea and its infusion; Coffee and its infusion; Cocoa and its products; Sweets; Mineral and drinking water; Alcoholic beverages. The main inclusion criterion was whether the article contained evaluation of data obtained by using combination of more advanced analytical and chemometric (mainly multivariate) methods/techniques. The exclusion criteria were: small number of the samples studied, lack of sufficiently advanced analytical and chemometric methods or techniques.
Results
The search retreived 1478 articles of which 341 were included in the review.
Analytical and chemometric methods
The following analytical methods have been routinely applied: Atomic Absorption Spectrometry with four techniques, i.e. flame technique (FAAS), electrothermal (ETAAS), cold vapor (CV-AAS), hydrogen generation (HG-AAS) as well as Inductively Coupled Plasma – Mass Spectrometry (ICP-MS) and Inductively Coupled Plasma – Optical Emission Spectrometry (ICP-OES). Reliability and correctness of concentration data were checked under the quality assurance test by the use of appropriate certificate reference materials (CRMs) with declared, known concentration of analytes [1-2]. The validated analytical data were then processed chemometrically by means of univariate, bivariate and other multivariate techniques, e.g. bar charts, histograms, one-way ANOVA, correlation and regression analysis and other, advanced and frequently applied techniques such as Principal Component Analysis (PCA) or Factor Analysis (FA) and Cluster Analysis (CA) or Hierarchical Cluster Analysis (HCA) [3-12]. Among the different criteria for determining the number of components/factors, the Kaiser criterion was selected and therefore factors greater than 1 were exclusively considered and interpreted. The aim of multivariate data analysis is to divide data matrix into its components to reduce relatively numerous variables to a smaller number of orthogonal factors. Such approach guarantees achieving a high degree of generalization of registered tendencies or statistical relationships, and what more, at a high level of statistical significance [2, 3, 13].
Meat
Bromatological, analytical and chemometric assessment of foods of animal origin based often on stable chemical elements has attracted a special attention of environmentalists as well as scientists specializing in food. Such investigations resulted in recognition of environmental parameters differentiating geographical distribution and diverse assortment of defatted mutton samples [14], pork belly [15], poultry breast meet and dried beef samples [16-17], labeling lamb meat [18], bovine muscles [19-22], liver, kidney and muscle of sheep [23], beef steak [24-25], pork [26], pork, beef and chicken [27-28] and others.
Fish and other seafood
Interesting information is also available on the application of chemometrics in assessment of world-wide populations of fish; such investigations were performed by many researchers, e.g. Julshamn and Grahl-Nielsen [29], Szefer et al. [30], Molkentin et al. [31], Ye et al. [32], Yamashita et al. [33], Li et al. [34], Ahmed et al. [35], Rahman et al. [36] and Marpaung et al. [37]. Chemometric processing of mineral composition related to vendace caviar has been performed by Rodushkin et al. [38]. Edible mussels were also analysed and assessed chemometrically, e.g. by Struck et al. [39], Favretto et al. [40], Bechmann et al. [41], Julshamn and Grahl-Nielsen [29], Szefer and Wołowicz [42], Szefer et al. [4-5, 42-45], Mesa et al. [46], Bartolomé et al. [47], Przytarska et al. [48], Chen et al. [49] and Bennion et al. [50, 51]. Among marine organisms also edible crustaceans were investigated by Li eal. [52-55] and Nędzarek et al. [56-58]. Kwoczek et al. [59] analysed different assortment of seafood available in Poland exported from different geographical regions.
Milk and dairy products
Milk and its products from different geographical regions were analysed for mineral component composition to assess their authenticity in the view of chemometric evaluation, among others milk [18, 60-67], commercial skim milk powders sweet whey and different milk-based infant formulae [68-79], cheeses [80-85], butter, margarine, and peanut butter [37] and eggs [86-89].
Honey
Honey samples were also chemometrically classified relative to their type and origin based on the content of chemical elements [7, 90-114].
Cereal products
Application of the chemometric techniques in evaluation of cereal products in view of their mineral composition was performed by many researchers, e.g. wheat samples [115- 117], rice [118-125], wheat, barley and faba bean [126], buckwheat [127-128] and sorghum [129-130]. Different kinds of grain products (bread, cereals, rice, flour, pasta) purchased from the local market in Poland originated from 14 different countries were analysed and evaluated chemometrically by Grembecka [8] and Grembecka et al. [131].
Oils, oilseeds and nuts
Mineral components of edible oils [132-137] as well as oilseeds and nuts [138-145] were analysed and evaluated chemometrically. Six different kinds of oilseeds purchased from the local market in Poland originated from 6 different countries were investigated and assessed by Grembecka [8].
Vegetables and fruits
Different types of vegetables originated from various geographical regions were studied in accordance of chemometric evaluation of chemical elements concentration, namely potato [146-152], tomato [153-155], cabbage [156- 157], broccoli [158], caper [159, 160], carrot [161, 162], onion [163-169], garlic [170-172], beetroot [173], pea, bean, faba bean [164, 174-175], lentil [176], parsley, carrot, onion, carrot, cabbage, lettuce, cucumber, green bean [177], parsley [178], paprika [179], chili pepper [180], Sechium edule fruits [181], Caigua [182], Taro [183] and sea cucumber [184]. Twenty five different kinds of commercially available fresh and processed vegetables and 5 kinds of leguminous vegetables purchased from the local market in Poland originated from 4 different countries and other EU countries were investigated and assessed by Grembecka [8] and Grembecka et al. [185].
The following assortment of fruits was assayed and estimated: pear [186], apple [187], lemon pulps samples [188], orange [189], pomelo [190], kaki fruit [191] and fruit juice, i.e. lemon juice [192, 193], grape juice [194, 195] and orange juice [196]. Twenty four different kinds of commercially available fresh fruits purchased from the local market in Poland originated from different countries were analysed and assessed by Grembecka and Szefer [9].
Tea and coffee
Different kinds of tea originated from various countries were analysed and chemometrically classified in view of chemical elements composition by Marcos et al. [197], Wong et al. [198], Fernández-Cáceres et al. [199], Herrador and González [200], Moreda-Piñeiro et al. [201, 202], Fernández et al. [203], Chen et al. [204], McKenzie et al. [205], Mbaye et al. [206], Marcelo et al. [207], Paz-Rodríguez et al. [208], Brzezicha-Cirocka et al. [11, 209-211], Ma et al. [212], Milani et al. [213], Ye et al. [214], Lou et al. [215], Zhao et al. [216- 219], Malinowska et al. [220], Zhang et al. [221], Idrees et al. [222], Liu et al. [223-226] and Motta et al. [227].
There are also numerous available literature data on application of the chemometric techniques in analytical evaluation of coffee in view of their mineral composition. Differentiation and classification of coffee samples have been achieved by Krivan et al. [228], Martin et al. [229-231], dos Santos et al. [232], Anderson and Smith [233], Fernandes et al. [234], Filho et al. [235], Grembecka et al. [236], Akamine et al. [237], Muñiz-Valencia et al. [238], Valentin et al. [239], Barbosa et al. [240], Liu et al. [241], Oliveira et al. [242], Szymczycha-Madeja et al. [243], Habte et al. [244], Mehari et al. [245], Pohl et al. [246], Zhang et al. [247], Al-Jaf and Saydam [248], Cloete et al. [249], Worku et al. [250], Endaye et al. [251], Voica et al. [252] and Bitter et al. [253].
Confectionary products
Different beet and cane sugar products (cane sugar plants, maple syrup, crude and syrup juices, molasses, the end products of consumer sugar) have been investigated and assessed chemometrically in aspect of the mineral composition by several authors, e.g. Awadallah et al. [254], Nunes et al. [255], Rodushkin et al. [256], Grembecka and Szefer [257], Barbosa et al. [258], Andrade et al. [259] and Guedes and Pereira [260]. Different ingredients such as sugarcane, soy, citrus, coffee, maize, eucalyptus, mango, bean, banana, lettuce, brachiaria, pearl millet, grape, rubber tree and tomato were analysed by de Carvalho et al. [261]. Chemometric estimation of both the confectionary and geographical provenance of cocoa and chocolate was performed by some authors, e.g. Pedro et al. [262], Grembecka and Szefer [257], Bertoldi et al. [263], Junior et al. [264], Kruszewski and Obiedziński [265] and Vanderschueren et al. [266].
Mushrooms
Chemometric techniques have been used to explore the elemental data for different species of mushrooms coming from various geographical areas, e.g. by Malinowska et al. [10], Cocchi et al. [267], Chudzyński et al. [268, 269], Falandysz et al. [270-273], Pająk et al. [274], Drewnowska and Falandysz [275], Kojta et al. [276-277], Mleczek et al. [278], Niedzielski et al. [279], Brzezicha-Cirocka et al. [280], Wang et al. [281], Zsigmond et al. [282], Buruleanu et al. [283] and Nowakowski et al. [284].
Mineral water
Application of the chemometric techniques in analytical evaluation of mineral water in view of their elemental composition has been performed by Misund et al. [285], Versari et al. [286], Kraic et al. [287], Bityukova and Petersell [288], Birke et al. [289-291], Cicchella et al. [292], Demetriades et al. [293], Fugedi et al. [294], Dinelli et al. [295-297], Grošelj et al. [298], Kermanshahi et al. [299], Peh et al. [300], Avino et al. [301], Bertoldi et al. [302], Cidu et al. [303], Souza et al. [304], Banks et al. [305], Flem et al. [306], Pantić et al. [307], Khan et al. [308] and Bodor et al. [309].
Alcoholic beverages
Different investigators have processed chemometrically the concentration of chemical elements in different kinds of red and white wines, including must, e.g. Latorre et al. [310], Barbaste et al. [311], Pérez Trujillo et al. [312], Marengo et al. [313], Coetzee et al., [314], Gonzálvez et al. [315], Rodríguez et al. [316], Aceto et al. [317], Durante et al. [318], Catarino et al. [319], Pořízka et al. [320], Cruz et al. [321], Dembroszky et al. [322], Shimizu et al. [323] and Grembecka et al. [324]. Chemometric evaluation of mineral composition of beers appeared to be useful in the classification of different features of this alcoholic beverage as has been proved by Bellido-Milla et al. [325], Alcázar et al. [326], Wyrzykowska et al. [327], Mahmood et al. [328], Carter et al. [329], Voica et al. [330], Rodrigo et al. [331], Styburski et al. [332] and Redan et al. [333]. Ciders were also studied and chemometricaly considered relative to their mineral composition [334-335] as well as to different kinds of Scotch whisky [336], sherry brandy, whisky [337-338] and traditional Galician orujo alcoholic distillates with and without a certified brand of origin (CBO) [339].
Differentiation of geographical origin
For instance, a clear discrimination between soft tissue of Mytilide originated from different coastal regions of subarctic, temperate, subtropical and tropical marine ecosystems was achieved owing to use of FA technique [45]. Object samples are separately distributed along F1 axis (relative to F1 score values) corresponding to edible mollusks inhabited coastal regions of marine ecosystems including also intertidal zones of Atlantic, Pacific and Indian Ocean (Table 1).
Interesting results were obtained in investigations of cockle (C. edule) from the Gulf of Gdansk (Southern Baltic), Marennes-Oleron Bay, Arcachon Bay (French Atlantic coast) and Embez Islands (Mediterranean Sea). The PCA data displayed that Mn and Fe are responsible for discrimination between individuals originated from Marennes-Oleron Bay and Arcachon Bay whilst Zn, Cd and partly Ni have a main contribution in separation of the Gulf of Gdansk from the others [42].
It was also stated that FA technique is helpful in discrimination of the Korean Peninsula mussel M. galloprovincialis with respective to its geographical origin, i.e. from the Masan Bay and the Ulsan Bay, i.e. more and less polluted regions with heavy metals, respectively [6].
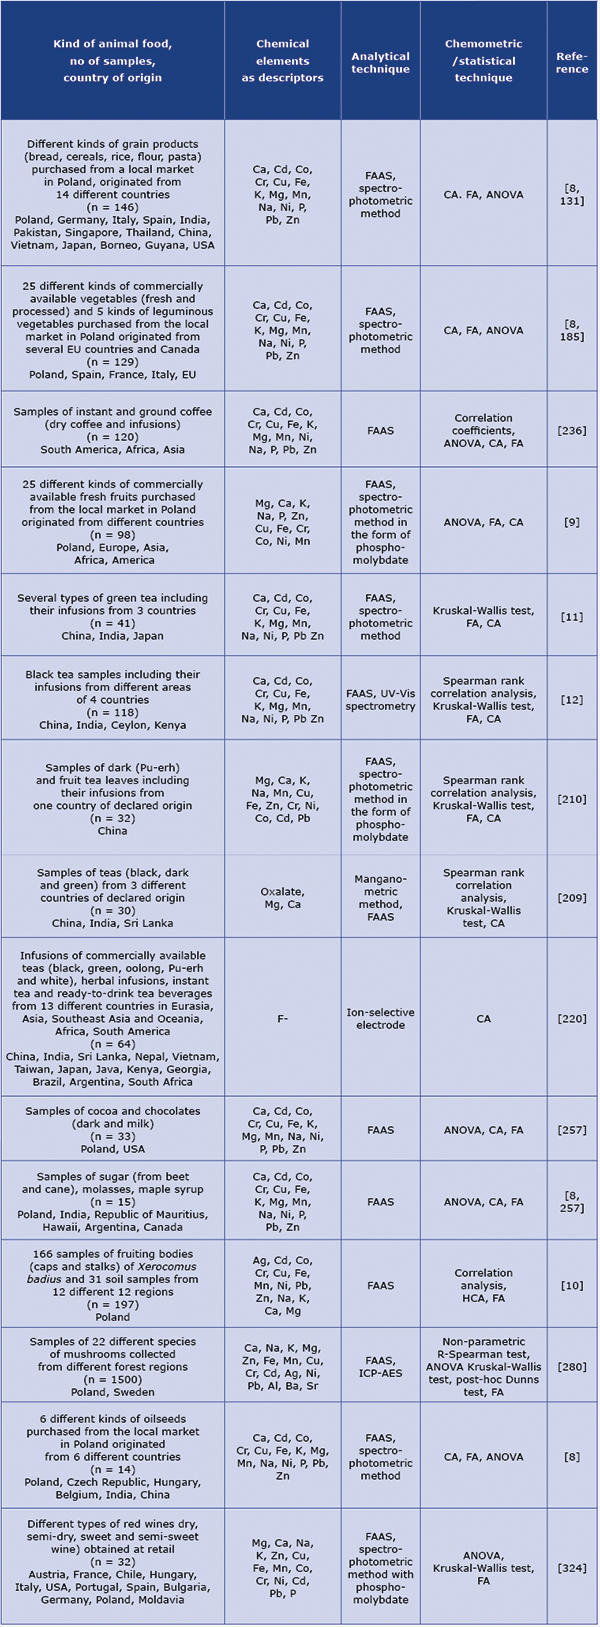
Another exemplar concerns application of CA technique in processing of concentration data obtained for Boletus edulis mushroom and the adjacent soil as substratum from 12 different forest regions of Poland (Table 2). There is a significant grouping of samples collected in the Tricity Landscape Park, adjacent to the Tricity agglomeration and Pb is a main descriptor responsible for separation of this region from other 11 Polish forest sampling sites as protected areas, deprived of industrial and urban influences [10]. Based on obtained concentration data corresponding to 22 different species of mushrooms collected from different forest regions of Poland it is found that C. cibarius, B. edulis and L. scabrum were diversified relative to their geographical provenance [280].
Interesting results were reported for tea samples imported from Asiatic countries which allow differentiation of object scores corresponding to Japan, India and China as well as it was possible to identify particular varieties of the green tea studied (Sencha, Kokeicha, Bancha, Darjeeling, Gunpowder, Chun Me and Yunnan) [11]. Two multivariate techniques, i.e. FA and CA were applied to differentiate black tea samples and their infusions in view of their geographical origin. These chemometric tools proved to be able to discriminate samples according to their provenance as well as plantation within the common regions [12].
CA technique allowed differentiation of teas relative to the country of origin, i.e., China, India, Ceylon and Kenya as well as it was useful in distinguishing of teas originated from various plantations within a single country. Thus, chemometrics proved to be effective tool to discriminate these samples in view of their provenance as well as plantation within the common region. Moreover, FA technique appeared to be useful in differentiating of various wine varieties in aspect of their geographical origin [324].
Differentiation of varietal origin
As shown in Table 1, the FA technique appeared to be helpful research tool in analysis of diverse assortment of seafood (oysters, mussels, prawns, surimi products, octopus, squids, octopuses, crabs, lobsters) originated from various over-worlds waters bordering 8 countries, i.e. Norway, England, Spain, India, Thailand, Canada, Philippines and New Zealand. Obtained data documented significant discrimination between factorial distribution of scores with respect to a degree of technological processing (described by F1 values) and taxonomic features of seafood [59].
Table 1. Application of the chemometric techniques in analytical evaluation of animal food in view of its mineral composition
Based on the FA technique, it is found that samples of artificial honey are separated from samples of natural honey. Moreover, natural honeys indicated a clear differentiation relative to their botanical origin. CA technique resulted in the dendrogram consisted of two main clusters, i.e. representing dark and light color honeys. The dark color honeys cluster contains generally samples corresponding to honeydew, buckwheat and heather honeys, while the second cluster is consisted of acacia, lime, rape and multifloral honeys. The FA technique appeared to be effective chemometric tool to separate the data concerning artificial honey samples (described by the highest levels of Ca and Na) whilst natural honeys and those with natural additives were characterized by K, P, Cu, Mn and Mg. Moreover, F2 achieved the lowest values for natural and syrup-feed honeys identified by high levels of Fe and Zn [7].
The analytical data obtained for different kinds of grain products (bread, cereals, rice, flour, pasta) purchased from the local market in Poland were also processed chemometrically (Table 2). FA appeared to be helpful technique in differentiating these products according to their type, especially in case of flour and rice [8, 131].
Table 2. Application of the chemometric techniques in analytical evaluation of plant food in view of its mineral composition
It was possible to discriminate numerous types of vegetables and fruits relative to their botanical type. Vegetables, legumes and oilseeds were characterized by the most effective discrimination by means of FA technique [8, 185]. There is differentiation of fruits in view of their belonging to botanical type (accessory, berry, pip and stone fruits) and family, i.e. Grossulariaceae (GR), Actinidiaceae (AC), Musaceae (MU), Bromeliaceae (BR), Cucurbitaceae (CU), Caricaceae (CA), Anacardiaceae (AN), Rosaceae (RO), Rutaceae (RU), Lauraceae (LA), Vitaceae (VI) and Ericaceae (ER) [9].
Chemometric analysis (ANOVA Kruskal Wallis test, Dunn’s test, R-Spearman correlation, FA) of 6 species of mushrooms from 2 forest regions of Poland indicated that Ca, Na, K, Mg, Zn, Fe, Mn, Cu and Cd are effective descriptors of interspecies differentiation [280].
Authenticity of confectionery products was assessed based on CA data which distinguished samples of varied types in view of their botanical origin. According to [257], hierarchical dendrogram distinguishes two main clusters corresponding to the analyzed chocolate samples. The first cluster of scores represents dark chocolates, while the second one grouping milk chocolates. Dark chocolates are adjacent to subclusters representing cocoa products with content > 70% (C2–C4, C13) and others. However, dark chocolates, with declared cocoa content at least 45% (C7, C11), are ascribed to the grouping of milk chocolates (C15-C21), which means that these products contain less of cocoa than was stated on the label by the producer. Therefore, CA technique appeared to be effective tool in fraud detection [257].
As for coffee analysis (Table 2), chemometric assessment was performed in aim of categorization of samples in view of varieties characteristics. Based on FA data, classification of object samples and variables (loadings) relative to numerous coffee samples was achieved [236]. Analysis of their different technological forms (ground, instant coffee and coffee infusions) resulted in clear discrimination of the particular varieties of this assortment. Interesting results were obtained based on FA data which makes possible to distinguish arabica from robusta coffees. Higher values of F1 corresponded to 100% coffee of one bean type. Expensive brand coffee samples are generally situated near arabica coffee scores whilst less expensive brands are corresponded to robusta ones. It is pointed out that Mn is the best descriptor for identification of arabica samples whilst P identifies robusta ones [236].
Chemometric assessment was also helpful in classification of different types of teas based on their mineral composition (Table 2). For instance, CA technique was successfully used to identify several varieties of tea, e.g., Earl Grey, Assam, Ceylon and English Breakfast. Moreover, based on content of oxalates, Ca and Mg, it was possible to differentiate three types of tea according to their degree of technological processing (fermentation), i.e. black, green and Pu-erh tea [209].
Promising results were obtained for different assortment of wines (Table 2). A statistically significant correlation was found between the type of wine and the content of alcohol, K, P, Co and Pb concentrations. Moreover, FA technique allowed differentiation of individual types of wine based on its elemental composition. Macroelements such as Ca, K and P were responsible for distinguishing the group of dry wines and semi-dry wines corresponded to Pb, Cr, Co and Mg, while sweet wines contained the highest levels of Zn and Ni [324].
Differentiation of degree of pollution and other parameters
Bearing in mind the need to guarantee the quality of food, several multivariate techniques have been applied in identification of the sources of chemical pollutants in food. For instance, PCA data concerning heavy metals in molluscs of the Gulf of Gdansk, French Atlantic coast and the Mediterranean Sea (Table 1) allowed for identification of the population of zoobenthos exposed to Zn, Cd and partly Ni in the Gulf of Gdansk. It means that anthropogenic sources could be responsible for higher levels of these three elements in contrast to specimens inhabited the French aquatic regions. Moreover, besides the inter-regional differentiation also seasonal factors have an important influence on the heavy metals content in the cockles [42]. Seasonal variations were also observed in case of mussel M. galloprovincialis from the southern part of the Korean Peninsula [6]. ANOVA data indicated that seasonal variations in the both regions, i.e. the Ulsan Bay and the Masan Bay are statistically significant for mussel content of Cd, Co, Cr, Cu, Fe, Hg, Mn, Ni, Ti, Pb, Sn and Zn. Moreover, based on FA data, the Masan Bay and partly of the Ulsan Bay samples were identified by the lowest values of F1, whilst most mussel samples originated from the Ulsan Bay situated near heavily industrialized area were described by the highest values of F1 [6].
For instance, concentration data for perch from southern Baltic was processed by chemometric techniques (Table 1). It is concluded that Hg in muscle and Cd, Pb and Cu in liver are descriptors for factorial differentiation of age groups of the fish investigated. The positive relationship between muscle Hg and age (weight-length) seems to be associated with the specific bioaffinity of CH3Hg with a high biological half-life. Moreover, FA technique supported seasonal differences in muscle and especially hepatic samples; specifically, summer muscles were clearly separated from winter ones [30].
RDA and PTWI
The concentration data obtained for food have been frequently applied for an assessment of the hypothetical percentage realization of the recommended dietary intakes (RDA) for the essential elements in question and of provisional tolerable weekly intakes (PTWI) of toxic elements from the consumption of 100 g food product. For instance, Cd and Pb levels in muscle of perch are significantly lower than the PTWI and do not constitute any threat to man [30].
RDA and PTWI values of 15 elements were assessed for edible parts of 8 types of shellfish products. As for the former one, higher percentages of Ca (38. 8), Mg (17.2-22.5), Zn (88.2-121), Cu (88.2) and Se (155) were generally achieved for crabs. High values were also observed for lobsters, i.e. Ca (18.2), Mg (8.1-11.9), Zn (38.8-53.4), Cu (204) and Se (120). It should be emphasized that high RDA was also obtained for Mn (174-222) and Fe (52.6-118) in great scallop and mussels in shell, respectively. In view of the PTWI assessed for seafood products characterized by the highest levels of Hg, Cd and Pb, no health hazard is posed by exposure to these toxic heavy metals through seafood consumption [59].
Assessed RDA values for bee honey and syrup-feed honeys ranged from 0.35% (Na) to 5.84-23.4% (Cr) and from 0.20% (Na) to 3.85-15.4% (Cr), respectively. Consumption of bee products supplies human organism with the lowest and the highest percentages of RDA, i.e. from 1.21% (Na) to 68.5- 103% (Mn) and 119-478% (Cr) [7].
It is reported that consumption of 100 g different kinds of grain products provides daily human organism with bioelements within a range of 0.33% (Na) to 321 (Cr) and 353- 530% (Mn). It means that the highest average percentages of RDA were observed for Cr and Mn in bran and germs [8]. Assessment of PTWI for Pb and Cd in different cereal products (bread, cereals, rice, flour, pasta) allowed to conclude that consumption of 100 g of these products did not exceed allowed daily intake of both toxic heavy metals.
RDA values of 11 essential elements ranged from 1.65 to 2.07% (Cu) for fresh vegetables, 1.26-1.58% (Cu) to 40.8% (Na) for processed vegetables and 18.3% (Na) to 211-269% (Fe), 149-224% (Mn) and 72.7-291% (Cr) for dried vegetables. The latter three elements exceeded recommended dietary intakes resulting from daily consumption of 100 g different vegetables. As for RDA for legumes, minimum values achieved for Na (0.25%), whilst maximum values for P (94.7%). In case of oilseeds they oscillated between 2.29% (Na) and from 168% (P) to 173% (Mn) [8]. Referring to PTWI it is found that daily consumption of 100 g fresh, processed or dried vegetables poses no health hazard relative to Pb and Cd of food origin.
It is shown that RDA reached the highest values for K, Mg and Cu in 22 species of mushrooms. Based on PTWI it was concluded that the consumption of mushrooms collected from different forest regions of Poland poses no risk to human health [280].
Confectionary products (beet and cane sugar, molasses, maple syrup, cocoa, dark and milk chocolates) were also categorized according to hypothetical percentage realization of the recommended dietary intakes (RDA) for the essential elements in question. RDA values obtained for 11 elements in beet and cane sugar and its products such as molasses and maple syrup varied from 0.37% (Zn) to 8.19-32.8% (Cr) and from 2.28% (Ca) to 78.6-118% (Mn), respectively. Among all the analyzed confectionary products, cocoa was characterized by the highest RDA values, i.e. 41.6-51.9% (Na), 61.1% (K), 97.7-147% (Mn), 129% (P), 149-186% (Cu), 262-333% (Fe) and 215-862% (Cr). Dark and milk chocolates contained accordingly less essential elements than cacao. Relatively high RDA values were obtained for dark chocolate, i.e. 15.8-22.1% (Zn), 16.5% (P), 20.6% (K), 34.4-43.0% (Mg), 44.5-66.8% (Mn), 60.2-241% (Cr), 63.2-80.4% (Fe) and 67.1-83.9% (Cu). RDA values for milk chocolate were appropriately lower as compared with those obtained for dark chocolate [257]. Based on PTWI values for Pb and Cd, there is no threat to human health resulting from the consumption of honey [7] and confectionary products [257].
Concerning RDA estimated for essential elements, it is concluded that consumption of instant coffee supplies human organism with the highest average percentages of realization of this index for adult [236]. Based on assessed PTWI for Cd and Pb corresponding to their content in 2 cups of coffee, it is shown that daily consumption of coffee did not exceed the tolerance limit (0.21% for Pb and 0.22% for Cd) [236].
Bearing in mind that the RDA of Mn approximately amounted to 15 % and 28.3% for black tea and green tea, respectively, it seems that black and green teas could be a good source of Mn. However, its bioavailability to the human body needs to be considered [11-12]. It is reported that one cup of black tea or green tea provided very low levels of Pb and Cd suggesting that consumption of both tea varieties does not exceed the PTWI recommendation for these toxic heavy metals.
Conclusions
Instrumental methods, e.g. spectroscopy combined with multivariate analysis techniques, appear to be helpful in quantitative food authentication, identification of adulterants/mislabeling and determination of food safety. The proper use of analytical and chemometric tools for assessing nutritive and health quality of animal and plant foods plays an important role in quality control, their classification in view of geographical origin, confection and degree of environmental pollution. Both these techniques would be useful in differentiating unprocessed and technologically processed food as well as detecting fraud to preserve the brand name of the original product. Application of chemometric tools leads to a deeper understanding of the distribution of mineral components in foods, what is especially important feature in the bromatological and ecotoxicological aspect.
Funding
None.
Conflicts of interest
None.
References
| 1. |
Capar SG, Szefer P. Determination and speciation of trace elements in foods. In: Methods of Analysis of Food Components and Additives (Ed. Otles S), Second Edition, CRC Press – Taylor & Francis Group, Boca Raton, 2012. Chap. 8: p. 165-210.
|
| 2. |
Grembecka M, Szefer P. Elemental trace analysis in studies of food products. In: Handbook of Trace Analysis – Fundamentals and Applications (Ed. Baranowska I), Springer, 2016. Chap. 9, p. 203-239. Available from: http://link.springer.com/10.1007/978-3-319-19614-5_9.
|
| 3. |
Szefer P. Application of chemometric techniques in analytical evaluation of biological and environmental samples. In: New Horizons and Challenges in Environmental Analysis and Monitoring (Eds. Namieśnik J, Chrzanowski W, Żmijewska P), CEEAM, Gdańsk, 2003. Chap. 18, p. 355-388.
|
| 4. |
Szefer P, Frelek K, Szefer K, Lee Ch-B, Kim B-S, Warzocha J, Zdrojewska I, Ciesielski T. Distribution and relationships of trace metals in soft tissue, byssus and shells of Mytilus edulis trossulus from the southern Baltic. Environ Pollut. 2002;120(2):423-444. Available from: https://www.sciencedirect.com/science/article/pii/S0269749102001112?via%3Dihub.
|
| 5. |
2002;120(2):423-444. Available from: https://www.sciencedirect.com/science/article/pii/S0269749102001112?via%3Dihub.
|
| 6. |
Szefer P, Wołowicz M, Kusak A, Deslous-Paoli J-M, Czarnowski W, Frelek K, Belzunce-Segarra M-J. Distribution of mercury and other trace metals in the cockle Cerastoderma glaucum from the Mediterranean Lagoon, Etang de Thau. Arch Environ Contam Toxicol. 1999;36(1):56-63. Available from: https://link.springer.com/article/10.1007/s002449900442.
|
| 7. |
Szefer P, Kim B-S, Kim C-K, Kim EH, Lee C-B. Trace metals in Mytillus edulis galloprovincialis and the associated water and suspended matter of the southern part of Korea Peninsula. Environ. Pollut. 2004;129(2):209-228. Available from: https://www.sciencedirect.com/science/article/pii/S0269749103004019?via%3Dihub.
|
| 8. |
Grembecka M, Szefer P. Evaluation of bee honeys quality based on their mineral composition using multivariate techniques. Environ Monit Assess. 2013;185(5):4033-4047. Available from: https://link.springer.com/article/10.1007/s10661-012-2847-y.
|
| 9. |
Grembecka M. Thesis entitled “Bromatological and chemometric assessment of plants food based on its mineral composition”, Medical Academy of Gdańsk, 2007;302 p. + 169 p. (supplements).
|
| 10. |
Grembecka M, Szefer P. Comparative assessment of essential and heavy metals in fruits from different geographical origins. Environ Monit Assess. 2013;185(11):9139-9160. Available from: https://link.springer.com/article/10.1007/s10661-013-3242-z.
|
| 11. |
Malinowska E, Szefer P, Falandysz J. Metals bioaccumulation by bay bolete, Xerocomus badius, from selected sites in Poland. Food Chem. 2004;84(3):405-416. Available from: https://www.sciencedirect.com/science/article/pii/S0308814603002504.
|
| 12. |
Brzezicha-Cirocka J, Grembecka M, Szefer P. Monitoring of essential and heavy metals in green tea from different geographical origins. Environ Monit Assess. 2016;188(3):1-11. Available from: https://link.springer.com/article/10.1007%2Fs10661-016-5157-y.
|
| 13. |
Brzezicha-Cirocka J, Grembecka M, Ciesielski T, Flaten TP, Szefer P. Evaluation of macro- and microelement levels in black tea in view of its geographical origin. Biol Trace Elem Res. 2017;176(2):429-441. Available from: https://link.springer.com/article/10.1007%2Fs12011-016-0849-2.
|
| 14. |
Szefer P. Chemometric techniques in analytical evaluation of food quality, in: Mineral Components in Foods (Eds. Szefer P, Nriagu J), CRC Press – Taylor & Francis, FL, 2007. Chap. 4, p. 69-121.
|
| 15. |
Sun S, Guo B, Wei Y, Fan M. Multi-element analysis for determining the geographical origin of mutton from different regions of China. Food Chem 2011;124(3):1151-1156. Available from: https://www.sciencedirect.com/science/article/pii/S0308814610008678.
|
| 16. |
Kim JS, Hwang IM, Lee GH, Park YM, Choi JY, Jamila N, Khan N, Kim KS. Geographical origin authentication of pork using multi-element and multivariate data analyses. Meat Sci. 2017;123:13-20. Available from: https://pubmed.ncbi.nlm.nih.gov/27589244/.
|
| 17. |
Franke BM , Haldimann M, Reimann J, Baumer B, Gremaud G , Hadorn R, Bosset J-O, Kreuzer M. Indications for the applicability of element signature analysis for the determination of the geographic origin of dried beef and poultry meat. Eur Food Res Technol. 2007;225(3-4):501–509. Available from: https://core.ac.uk/download/pdf/159147881.pdf.
|
| 18. |
Franke BM, Haldimann M, Gremaud G, Bosset J-O, Hadorn R, Kreuzer M. Element signature analysis: its validation as a tool for geographic authentication of the origin of dried beef and poultry meat. Eur Food Res Technol 2008;227(3):701-708. Available from: https://core.ac.uk/download/pdf/159149666.pdf.
|
| 19. |
Bandoniene D, Walkner C, Ringdorfer F, Meisel T. Authentication of meat and dairy products using rare earth element labeling and detection by solution based and laser ablation ICP-MS. Food Res Intern. 2020;132:109106. Available from: https://www.sciencedirect.com/science/article/abs/pii/S0963996920301319.
|
| 20. |
Miranda M, Pereira V, Carbajales P, López-Alonso M. Importance of breed aptitude (beef or dairy) in determining trace element concentrations in bovine muscles. Meat Sci 2018; 145:101-106. Available from: https://pubmed.ncbi.nlm.nih.gov/29940402/.
|
| 21. |
Brito G, Peña-Méndez EM, Novotná K, Díaz C , Garcíaet FJ. Differentiation of heat- treated pork liver pastes according to their metal content using multivariate data analysis. Eur Food Res Technol. 2004;218(6):584-588. Available from: https://link.springer.com/content/pdf/10.1007%2Fs00217-004-0909-2.pdf.
|
| 22. |
Brito G, Novotná K, Peña-Méndez EM, Díaz C, García FJ. Correlation of heavy metal concentrations with various factors in canned liver paste products using multivariate statistical strategies. J Food Protect. 2004;67(9):1927-1932. Available from: https://pubmed.ncbi.nlm.nih.gov/15453583/.
|
| 23. |
Brito G, Andrade JM, Havel J, Díaz C, García FJ, Peña-Méndez EM. Classification of some heat-treated liver pastes according to container type, using heavy metals content and manufacturer’s data, by principal components analysis and potential curves. Meat Sci. 2006;74(2):296-302. Available from: https://www.sciencedirect.com/science/article/pii/S0309174006000957.
|
| 24. |
Pereira V, Miranda M, Sierra J, Benedito JL, López-Alonso M. Toxic and essential trace element concentrations in different tissues of extensively reared sheep in northern Spain. J Food Compos Anal. 2021;96:103709. Available from: https://www.sciencedirect.com/science/article/pii/S0889157520314149.
|
| 25. |
Dixit Y, Casado-Gavalda MP, Cama-Moncunill R, Cama-Moncunill X, Markiewicz-Keszycka M, Cullen PJ, Sullivan C. Laser induced breakdown spectroscopy for quantification of sodium and potassium in minced beef: A potential technique for detecting beef kidney adulteration. Anal Meth. 2017;9(22):3314-3322. Available from: https://pubs.rsc.org/en/content/articlelanding/2017/ay/c7ay00757d#!divAbstract.
|
| 26. |
Dixit Y, Casado-Gavalda MP, Cama-Moncunill R, Cama-Moncunill X, Markiewicz-Keszycka M, Jacoby F, Cullen PJ, Sullivan C. Introduction to laser induced breakdown spectroscopy imaging in food: Salt diffusion in meat. J Food Eng 2018; 216:120-124. Available from: https://www.sciencedirect.com/science/article/abs/pii/S0260877417303436.
|
| 27. |
Yao MY, Rao GF, Huang L, Liu MH, Chen JY, Chen TB. Simultaneous analysis of Cr and Pb in H. contaminated pork by laser-induced breakdown spectroscopy. Appl Opt. 2017;56(29):8148-8153. Available from: https://www.osapublishing.org/ao/abstract.cfm?uri=ao-56-29-8148.
|
| 28. |
Bilge G, Velioglu HM, Sezer B, Eseller KE, Boyaci IH. Identification of meat species by using laser-induced breakdown spectroscopy. Meat Sci 2016;119:118-122. Available from: https://www.sciencedirect.com/science/article/pii/S0309174016301346.
|
| 29. |
Mielczarek A., Grembecka Małgorzata, Szefer Piotr. Skład mineralny mięsa w świetle analizy chemometrycznej. In: VIII Polska Konferencja Chemii Analitycznej "Analityka dla społeczeństwa XXI wieku"[in Polish], Kraków, 4-9th July 2010.
|
| 30. |
Julshamn K, Grahl-Nielsen O. Distribution of trace elements from industrial discharges in the Hardangerfjord, Norway: A multivariate data analysis of saithe, flounder and blue mussel as sentinel organisms. Mar Pollut Bull. 1996;32(7):564-571. Available from: https://www.sciencedirect.com/science/article/pii/0025326X96845772.
|
| 31. |
Szefer P., Domagała-Wieloszewska M., Warzocha J., Garbacik-Wesołowska A., Ciesielski T. Distribution and relationships of mercury, lead, cadmium, copper and zinc in perch (Perca fluviatilis) from the Pomeranian Bay and Szczecin Lagoon, southern Baltic. Food Chem. 2003;81(1):73-83. Available from: https://www.sciencedirect.com/science/article/pii/S0308814602003801.
|
| 32. |
Molkentin J, Lehmann I, Ostermeyer U, Rehbein H. Traceability of organic fish − authenticating the production origin of salmonids by chemical and isotopic analysis. Food Control 2015;53(1):55-66. Available from: https://agris.fao.org/agris-search/search.do?recordID=US201900119801.
|
| 33. |
Ye S, Yang J, Liu H, Oshima Y. Use of elemental fingerprint analysis to Identify localities of collection for the large Icefish Protosalanx chinensis in Taihu Lake, China. J Fac Agr Kyushu Univ. 2011;56(1):41-45. Available from: https://kyushu-u.pure.elsevier.com/en/publications/use-of-elemental-fingerprint-analysis-to-identify-localities-of-c.
|
| 34. |
Yamashita Y, Omura Y, Okazaki E. Distinct regional profiles of trace element content in muscle of Japanese eel Anguilla japonica from Japan, Taiwan, and China. Fish Sci. 2006;72(5):1109-1113. Available from: https://link.springer.com/article/10.1111/j.1444-2906.2006.01263.x.
|
| 35. |
Li L, Boyd CE, Dong S. Chemical profiling with modeling differentiates Ictalurid cat fish produced in fertilized and feeding ponds. Food Contr. 2015;50:18-22. Available from: https://www.sciencedirect.com/science/article/abs/pii/S0956713514004630.
|
| 36. |
Ahmed ASS, Sultana S, Habib A, Ullah H, Musa N, Hossain MB, et al. Bioaccumulation of heavy metals in some commercially important fishes from a tropical river estuary suggests higher potential health risk in children than adults. PLoS ONE 2019;14(10):e0219336. Available from: https://pubmed.ncbi.nlm.nih.gov/31622361/.
|
| 37. |
Rahman MS, Molla AH, Saha N, Rahman A . Study on heavy metals levels and its risk assessment in some edible fishes from Bangshi River, Savar, Dhaka, Bangladesh. Food Chem. 2012;134(4):1847-1854. Available from: https://www.sciencedirect.com/science/article/pii/S0308814612005821.
|
| 38. |
Marpaung AM, Syahrun SN, Ramli M, Idris N, Khumaeni A, Budi WS et al. Emission spectrochemical analysis of soft samples Including raw fish by employing laser-induced breakdown spectroscopy with a subtarget at low-pressure helium gas. ACS Omega 2020;5(27):16811-16818. Available from: https://pubs.acs.org/doi/10.1021/acsomega.0c01904.
|
| 39. |
Rodushkin I, Bergman T, Douglas G, Engström E, Sörlin D, Baxter DC. Authentication of Kalix (N.E. Sweden) vendace caviar using inductively coupled plasma-based analytical techniques: Evaluation of different approaches. Anal Chim Acta 2007;583(2):310-318. Available from: https://www.sciencedirect.com/science/article/pii/S0003267006021131.
|
| 40. |
Struck BD, Pelzer R, Ostapczuk P, Emons H, Mohl C. Statistical evaluation of ecosystem properties influencing the uptake of As, Cd, Co, Cu, Hg, Mn, Ni, Pb and Zn in seaweed (Fucus vesiculosus) and common mussel (Mytilus edulis). Sci Total Environ. 1997;207(1):29-42. Available from: https://pubmed.ncbi.nlm.nih.gov/9397597/.
|
| 41. |
Favretto L, Campisi B, Reisenhofer E, Adami G. Terrigenous debris and mussel pollution – a differentiation based on trace element concentration by means of multivariate analysis. Anal Chim Acta 1997;344(3):251-259. Available from: https://www.sciencedirect.com/science/article/pii/S0003267097000317.
|
| 42. |
Bechmann IE, Stürup S, Kristensen LV. High resolution inductively coupled plasma mass spectrometry (HR-ICPMS) determination and multivariate evaluation of 10 trace elements in mussels from 7 sites in Limfjorden, Denmark. Fresenius J Anal Chem. 2000;368:708-714. Available from: https://link.springer.com/content/pdf/10.1007/s002160000576.pdf.
|
| 43. |
Szefer P, Wolowicz M. Occurrence of metals in the cockle Cerastoderma glaucum from dfferent geographical regions in view of principal component analysis. Oceanol Stud. 1993;64(3):253-264.
|
| 44. |
Szefer P, Ikuta K, Kushiyama S, Szefer K, Frelek K, Gełdon J. Distribution and association of trace metals in soft tissue and byssus of Mytilus edulis from the east coast of Kyushu Island. Japan Arch Environ Contam Toxicol. 1997;32(2):184-190. Available from: https://link.springer.com/article/10.1007/s002449900173.
|
| 45. |
Szefer P, Gełdon J, Ali AA, Paez-Osuna F, Ruiz-Fernandes AC, Guerrero Galvan SR. Distribution and association of trace metals in soft tissue and byssus of Mytella strigata and other benthal organisms from Mazatlan harbour, mangrove lagoon of the northwest coast of Mexico. Environ Intern. 1998;24(3):359-374. Available from: https://www.sciencedirect.com/science/article/pii/S0160412098000142.
|
| 46. |
Szefer P, Fowler SW, Ikuta K, Paez Osuna F, Ali AA, Kim B-S, Fernandes HM, Belzunce M-J, Guterstam B, Kunzendorf H, Wołowicz M, Hummel H, Deslous-Paoli M. A comparative assessment of heavy metal accumulation in soft parts and byssus of mussels from subarctic, temperate, subtropical and tropical marine environments. Environ Pollut. 2006;139(1):70-78. Available from: https://pubmed.ncbi.nlm.nih.gov/16023775/.
|
| 47. |
Mesa LM, Méndez EP, Sánchez MS, Montelongo FG. Interpretation of heavy metal data from mussel by use of mutivariate classification techniques. Chemosphere 1999;38(5):1103-1111. Available from: https://www.sciencedirect.com/science/article/pii/S0045653598003658?via%3Dihub.
|
| 48. |
Bartolomé L, Navarro P, Raposo JC, Arana G, Zuloaga O, Etxebarria N, Soto M. Occurrence and distribution of metals in mussels from the Cantabrian coast. Arch Environ Contam Toxicol. 2010;59(2):235-243. Available from: https://link.springer.com/article/10.1007/s00244-010-9476-7.
|
| 49. |
Przytarska JE, Sokołowski A, Wołowicz M, Hummel H, Jansen J. Comparison of trace metal bioavailabilities in European coastal waters using mussels from Mytilus edulis complex as biomonitors. Environ Monit Assess. 2010;166(1):461-476. Available from: https://link.springer.com/article/10.1007/s10661-009-1015-5.
|
| 50. |
Chen Ch-T, Banaru D, Sarnet T, Hermann J. Two-step procedure for trace element analysis in food via calibration-free laser-induced breakdown spectroscopy. Spectrochim Acta Part B 2018;150:77-85. Available from: https://www.sciencedirect.com/science/article/pii/S0584854718304166.
|
| 51. |
Bennion M, Morrison L, Brophy D, Carlsson J, Abrahantes JC, Graham CT. Trace element fingerprinting of blue mussel (Mytilus edulis) shells and soft tissues successfully reveals harvesting locations. Sci Total Environ. 2019;685:50-58. Available from: https://www.sciencedirect.com/science/article/abs/pii/S0048969719322740.
|
| 52. |
Bennion M, Morrison L, Shelley R, Graham C. Trace elemental fingerprinting of shells and soft tissues can identify the time of blue mussel (Mytilus edulis) harvesting. Food Contr. 2021;121:107515. Available from: https://www.sciencedirect.com/science/article/pii/S095671352030431X.
|
| 53. |
Li L, Boyd CE, Odom J. Identification of Pacific white shrimp (Litopenaeus vannamei) to rearing location using elemental profiling. Food Contr. 2014;45:70-75. Available from: https://www.sciencedirect.com/science/article/abs/pii/S0956713514001388.
|
| 54. |
Li L, Boyd CE, Racine P, McNevin AA, Somridhivej B, Minh HN, Tinh HQ, Godumala R. Assessment of elemental profiling for distinguishing geographic origin of aquacultured shrimp from India, Thailand and Vietnam. Food Contr. 2017;80:162-169. Available from: https://www.sciencedirect.com/science/article/abs/pii/S0956713517302402.
|
| 55. |
Li L, Ren W, Shuanglin S, Feng J. Investigation of geographic origin, salinity and feed on stable isotope profile of Pacific white shrimp (Litopenaeus vannamei). Aquaculture Res. 2018;49(2):1029-1036. Available from: https://onlinelibrary.wiley.com/doi/full/10.1111/are.13551.
|
| 56. |
Li L, Han C, Dong S, Boyd CE. Use of elemental profiling and isotopic signatures to differentiate Pacific white shrimp (Litopenaeus vannamei) from freshwater and seawater culture areas. Food Contr. 2019;95:249-256. Available from: https://www.sciencedirect.com/science/article/abs/pii/S0956713518304225.
|
| 57. |
Nędzarek A, Czerniejewski P, Tórz A. Microelements and macroelements in the body of the invasive Harris mud crab (Rhithropanopeus harrisii, Maitland, 1874) from the central coast of the South Baltic Sea. Environ Monit Assess. 2019;191(8):499. Available from: https://link.springer.com/article/10.1007/s10661-019-7564-3.
|
| 58. |
Nędzarek A, Czerniejewski P, Tórz A. Macro- and trace elements in Chinese mitten crabs (Eriocheir sinensis) from Szczecin Lagoon, Poland – Implications for human health. Aquaculture 2019; 506:229-237. Available from: https://www.sciencedirect.com/science/article/pii/S0044848618327364.
|
| 59. |
Nędzarek A, Czerniejewski P. The edible tissues of the major European population of the invasive Chinese mitten crab (Eriocheir sinensis) in the Elbe River, Germany, as a valuable and safe complement in essential elements to the human diet. J Food Compos Anal. 2020;96:103713. Available from: https://www.sciencedirect.com/science/article/pii/S0889157520314186.
|
| 60. |
Kwoczek M, Szefer P, Hać E, Grembecka M. Essential and toxic elements in seafood available in Poland from different geographical regions. J Agric Food Chem. 2006:54(8):3015-3024. Available from: https://pubs.acs.org/doi/10.1021/jf0600511.
|
| 61. |
Favretto LG, Marletta GP, Bogoni P, Favretto L. Chemometric studies of some trace elements in cows' milk. Z Lebensm-Unters- Forsch. 1989;189(2):123-127. Available from: https://link.springer.com/article/10.1007/BF01332945.
|
| 62. |
Benincasa C, Lewis J, Sindona G, Tagarelli A. The use of multi element profiling to differentiate between cow and buffalo milk. Food Chem. 2008;110(1):257-262. Available from: https://www.sciencedirect.com/science/article/pii/S0308814608001258.
|
| 63. |
Bilandžić N, Đokić M, Sedak M, Solomun B, Varenina I, Knežević Z, Benić M. Trace element levels in raw milk from northern and southern regions of Croatia. Food Chem. 2011;127(1):63-66. Available from: https://www.sciencedirect.com/science/article/pii/S0308814610017061.
|
| 64. |
Di Bella G, Turco VL, Potortì AG, Luppino RR, Fotia V, Conte F, Dugo G. Classification of the geographical origin of Italian donkey's milk based on differences in inorganic anions. Food Additiv Contam.: Part A 2012;29(7):1021-1029. Available from: https://www.tandfonline.com/doi/full/10.1080/19440049.2012.674979.
|
| 65. |
Król J, Litwińczuk Z, Brodziak A, Kędzierska-Matysek M. Content of selected essential and potentially toxic trace elements in milk of cows maintained in eastern Poland. J Elem. 2012;17(4):597-608. Available from: http://jsite.uwm.edu.pl/articles/view/306/.
|
| 66. |
Potortì AG, Di Bella G, Turco VL, Rando R, Dugo G. Non-toxic and potentially toxic elements in Italian donkey milk by ICP-MS and multivariate analysis. J. Food Compos. Anal. 2013:31(1):161-172. Available from: https://www.sciencedirect.com/science/article/pii/S0889157513000690.
|
| 67. |
Miedico O, Tarallo M, Pompa C, Chiaravall AE. Trace elements in sheep and goat milk samples from Apulia and Basilicata regions (Italy): Valuation by multivariate data analysis. Small Rumin Res. 2016;135:60-65. Available from: https://www.sciencedirect.com/science/article/pii/S0921448815003594.
|
| 68. |
Potočnik D, Nečemer M, Mazej D, Jaćimović R, Ogrinc N. Multi‐elemental composition of Slovenian milk: analytical approach and geographical origin determination. Acta Imeko 2016;5(1):15‐21. Available from: https://acta.imeko.org/index.php/acta-imeko/article/view/IMEKO-ACTA-05%20%282016%29-01-05.
|
| 69. |
Hermansen JE, Badsberg JH, Kristensen T, Gundersen V. Major and trace elements in organically or conventionally produced milk. J Dairy Res. 2005;72(3):362-368. Available from: https://pubmed.ncbi.nlm.nih.gov/16174368/.
|
| 70. |
Sola-Larrañaga C, Navarro-Blasco I. Preliminary chemometric study of minerals and trace elements in Spanish infant formulae. Anal Chim Acta 2006;555(2):354-363. Available from: https://www.sciencedirect.com/science/article/pii/S0003267005015424.
|
| 71. |
Ataro A, McCrindle RI, Botha BM, McCrindle CME, Ndibewu PP. Quantification of trace elements in raw cow’s milk by inductively coupled plasma mass spectrometry (ICP-MS). Food Chem. 2008;111(1):243-248. Available from: https://www.sciencedirect.com/science/article/pii/S030881460800352X.
|
| 72. |
Rey-Crespo F, Miranda M, López-Alonso M. Essential trace and toxic element concentrations in organic and conventional milk in NW Spain. Food Chem Toxic. 2013;55:513-518. Available from: https://www.sciencedirect.com/science/article/abs/pii/S0278691513000884?via%3Dihub.
|
| 73. |
Azcarate SM, Savio M, Smichowski P, Martinez LD, Camiña JM, Gil RA. Single-step solubilization of milk samples with N,N-dimethylformamide for inductively coupled plasma-mass spectrometry analysis and classification based on their elemental composition. Talanta 2015;143:64-70. Available from: https://www.sciencedirect.com/science/article/pii/S003991401500346X.
|
| 74. |
Azcarate SM, Gil R, Smichowski P, Savio M, Camiña JM. Chemometric application in foodomics: Nutritional quality parameters evaluation in milk-based infant formula. Microchem J. 2017;130:1-6. Available from: https://www.sciencedirect.com/science/article/pii/S0026265X16301928.
|
| 75. |
Bilge G, Sezer B, Eseller KE, Berberoglu H, Topcu A, Boyaci IH. Determination of whey adulteration in milk powder by using laser induced breakdown spectroscopy. Food Chem. 2016;212:183-188. Available from: https://www.sciencedirect.com/science/article/pii/S0308814616308597.
|
| 76. |
McLeod RJ, Prosser CG, Wakefield JW. Identification of goat milk powder by manufacturer using multiple chemical parameters. J Dairy Sci. 2016;99(2):982-993. Available from: https://www.sciencedirect.com/science/article/pii/S0022030215009108.
|
| 77. |
Zain SM, Behkami S, Bakirdere S, Koki IB. Milk authentication and discrimination via metal content clustering – A case of comparing milk from Malaysia and selected countries of the world. Food Contr. 2016;66:306-314. Available from: https://www.sciencedirect.com/science/article/abs/pii/S0956713516300603.
|
| 78. |
Akele ML, Abebe DZ, Alemu AK, Assefa AG, Madhusudhan A, de Oliveira RR. Analysis of trace metal concentrations in raw cow’s milk from three dairy farms in North Gondar, Ethiopia: chemometric approach. Environ Monit Assess. 2017;189(10):499. Available from: https://link.springer.com/article/10.1007%2Fs10661-017-6203-0.
|
| 79. |
Zhou X , Qu X, Zhao S, Wang J, Li S , Zheng N. Analysis of 22 elements in milk, feed, and water of dairy cow, goat, and buffalo from different regions of China. Biol Trace Elem Res. 2017;176(1):120-129. Available from: https://link.springer.com/article/10.1007%2Fs12011-016-0819-8.
|
| 80. |
Chen L, Li X, Li Z, Deng L. Analysis of 17 elements in cow, goat, buffalo, yak, and camel milk by inductively coupled plasma mass spectrometry (ICP-MS). RSC Advan. 2020;10(12):6736-6742. Available from: https://pubs.rsc.org/en/content/articlelanding/2020/ra/d0ra00390e#!divAbstract.
|
| 81. |
Suhaj M, Koreňovská M. Identification of cheese species origin by pattern recognition processing of elemental data. J Food Nutr Res. 2007;46(4):174-180. Available from: https://agris.fao.org/agris-search/search.do?recordID=SK2008000174.
|
| 82. |
Suhaj M, Koreňovská M. Correlation and distribution of elemental markers of origin in the production of Bryndza sheep cheese. Food Chem. 2008;107(1):551-557. Available from: https://www.sciencedirect.com/science/article/pii/S0308814607008278.
|
| 83. |
Suhaj M, Koreňovská M. The use of mineral and trace elements profiles for cows’ and goats’ cheese species prediction. J Food Nutr Res. 2010;49(4):178-185. Available from: https://vup.sk/en/index.php?mainID=2&navID=34&version=2&volume=49&article=953.
|
| 84. |
Moreno-Rojas R, Cámara-Martos F, Sánchez-Segarra PJ, Amaro-López MA. Influence of manufacturing conditions and discrimination of Northern Spanish cheeses using multi-element analysis. Inter J Dairy Techn. 2012;65(4):594-602. Available from: https://onlinelibrary.wiley.com/doi/full/10.1111/j.1471-0307.2012.00853.x.
|
| 85. |
Osorio MT, Koidis A, Papademas P. Major and trace elements in milk and Halloumi cheese as markers for authentication of goat feeding regimes and geographical origin. Inter J Dairy Technol. 2015;68(4):573-581. Available from: https://onlinelibrary.wiley.com/doi/full/10.1111/1471-0307.12213.
|
| 86. |
Mielczarek A. Ph.D. Thesis entitled „Bromatological and chemometric assessment of the chosen dairy products based on their mineral composition”. Medical Academy in Gdańsk 2010.
|
| 87. |
de Freitas R, Nacano RL, Batista B.L., Barbosa F. Jr. Toxic and essential elements in conventional and home-produced eggs by ICP-MS analysis. Food Additiv Contam Part B Surveill. 2013;6(1):30-35. Available from: https://www.tandfonline.com/doi/full/10.1080/19393210.2012.721095.
|
| 88. |
Barbosa RM, Nacano LR, Freitas R, Batista BL, Barbosa F. Jr. The use of Decision Trees and Naïve Bayes Algorithms and trace element patterns for controlling the authenticity of free-range-pastured hens’ eggs. J Food Sci. 2014;79(9):C1672-C1677. Available from: https://onlinelibrary.wiley.com/doi/full/10.1111/1750-3841.12577.
|
| 89. |
Borges EM, Volmer DA, Gallimberti M, de Souza DF, de Souza EL, Barbosa F. Jr. Evaluation of macro- and microelement levels for verifying the authenticity of organic eggs by using chemometric techniques. Anal Meth. 2015;7(6):2577-2584. Available from: https://pubs.rsc.org/en/content/articlelanding/2015/AY/c4ay02986k#!divAbstract.
|
| 90. |
Esposito M, Cavallo S, Chiaravalle E, Miedico O, Pellicanò R, Rosato G, Sarnelli P, Baldi L. Trace elements in free-range hen eggs in the Campania region (Italy) analyzed by inductively coupled plasma mass spectrometry (ICP-MS). Environ Monit Assess. 2016;188(6):326. Available from: https://link.springer.com/article/10.1007%2Fs10661-016-5316-1.
|
| 91. |
Latorre MJ, Peña R, Pita C, Botana A, Garcı́a S, Herrero C. Chemometric classification of honeys according to their type. II. Metal content data. Food Chem. 1999;66(2):263-268. Available from: https://www.sciencedirect.com/science/article/pii/S0308814698002179.
|
| 92. |
Latorre MJ, Peña R, García S, Herrero C. Authentication of Galician (N.W. Spain) honeys by multivariate techniques based on metal content data. Analyst 2000;125(2):307-312. Available from: https://pubs.rsc.org/en/content/articlelanding/2000/an/a905978d/unauth#!divAbstract.
|
| 93. |
Devillers J, Doré JC, Marenco M, Poirier-Duchêne F, Galand N, Viel C. Chemometrical analysis of 18 metallic and nonmetallic elements found in honeys sold in France. J Agric Food Chem. 2002;50(21):5998-6007. Available from: https://pubs.acs.org/doi/10.1021/jf020497r.
|
| 94. |
Terrab A, Hernanz D, Heredia FJ. Inductively coupled plasma optical emission spectrometric determination of minerals in thyme honeys and their contribution to geographical discrimination. J Agric Food Chem. 2004;52(11):3441-3445. Available from: https://pubs.acs.org/doi/abs/10.1021/jf035352e.
|
| 95. |
Hernández OM, Fraga JMG., Jiménez AI, Jiménez F, Arias JJ. Characterization of honey from the Canary Islands: determination of the mineral content by atomic absorption spectrophotometry. Food Chem. 2005;93(3):449-458. Available from: https://www.sciencedirect.com/science/article/pii/S0308814604007630.
|
| 96. |
González-Miret ML, Terrab A, Hernanz D, Fernández-Recamales MA, Heredia FJ. Multivariate correlation between color and mineral composition of honeys and by their botanical origin. J Agric Food Chem. 2005;53(7):2574-2580. Available from: https://pubs.acs.org/doi/abs/10.1021/jf048207p.
|
| 97. |
Fredes C, Montenegro G. Heavy metals and other trace elements contents in Chilean honey. Cien Inv Agr. 2006;33(1):50-58. Available from: https://www.researchgate.net/profile/Carolina-Fredes/publication/228624386_Heavy_metals_and_other_trace_elements_contents_in_Chilean_honey/links/0046353035d8c4a083000000/Heavy-metals-and-other-trace-elements-contents-in-Chilean-honey.pdf.
|
| 98. |
Raeymaekers R. A prospective biomonitoring campaign with honey bees in a district of UpperBavaria (Germany). Environ Monitor Assess. 2006;116(1):233-243. Available from: https://link.springer.com/article/10.1007/s10661-006-7389-8.
|
| 99. |
Madejczyk M, Baralkiewicz D. Characterization of Polish rape and honeydew honey according to their mineral contents using ICP-MS and F-AAS/AE. Anal Chim Acta 2008;617(1-2):11-17. Available from: https://www.sciencedirect.com/science/article/pii/S0003267008001372?via%3Dihub.
|
| 100. |
Schellenberg A, Chmielus S, Schlicht C, Camin F, Perini M, Bontempo L, Heinrich K, Kelly SD, Rossmann A, Thomas F, Jamin E, Horacek M. Multielement stable isotope ratios (H, C, N, S) of honey from different European regions. Food Chem. 2010;121(3):770-777. Available from: https://www.sciencedirect.com/science/article/pii/S0308814610000270.
|
| 101. |
Chudzinska M, Baralkiewicz D. Application of ICP-MS method of determination of 15 elements in honey with chemometric approach for the verification of their authenticity. Food Chem Toxicol. 2011;49(11):2741-2749. Available from: https://www.sciencedirect.com/science/article/abs/pii/S0278691511004297?via%3Dihub.
|
| 102. |
Cantarelli MÁ, Camiña JM, Pettenati EM, Marchevsky EJ, Pellerano RG. Trace mineral content of Argentinean raw propolis by neutron activation analysis (NAA): Assessment of geographical provenance by chemometrics. LWT - Food Sci. Technol. 2011;44(1):256-260. Available from: Available from: https://www.sciencedirect.com/science/article/abs/pii/S0023643810002495.
|
| 103. |
Vanhanen LP, Emmertz A, Savage GP. Mineral analysis of mono-floral New Zealand honey. Food Chem. 2011;128(1):236-240. Available from: https://www.sciencedirect.com/science/article/pii/S0308814611003232.
|
| 104. |
Chua LS, Abdul-Rahaman N-L, Sarmidi MR, Aziz R. Multi-elemental composition and physical properties of honey samples from Malaysia. Food Chem. 2012;135(3):880-887. Available from: https://www.sciencedirect.com/science/article/pii/S0308814612009557.
|
| 105. |
Rizelio VM, Gonzaga LV, da Silva Campelo Borges G, Maltez HF, Oliveira Costa AC, Fett R. Fast determination of cations in honey by capillary electrophoresis: A possible method for geographic origin discrimination. Talanta 2012;99:450-456. Available from: https://www.sciencedirect.com/science/article/pii/S0039914012004766.
|
| 106. |
Yücel Y, Sultanoğlu P. Characterization of Hatay honeys according to their multi-element analysis using ICP-OES combined with chemometrics. Food Chem. 2013;140(1-2):231-237. Available from: https://www.sciencedirect.com/science/article/pii/S0308814613002057.
|
| 107. |
Alqarni AS, Owayss AA, Mahmoud AA, Hannan MA. Mineral content and physical properties of local and imported honeys in Saudi Arabia. J Saudi Chem Soc. 2014;18(5):618-625. Available from: https://www.sciencedirect.com/science/article/pii/S1319610312001767.
|
| 108. |
Conti ME, Finoia MG, Fontana L, Mele G, Botrè F, Iavicoli I. Characterization of Argentine honeys on the basis of their mineral content and some typical quality parameters. Chem Centr J. 2014:8(1):44. Available from: https://link.springer.com/article/10.1186/1752-153X-8-44.
|
| 109. |
Di Bella G, Turco VL, Potortì AG, Bua GD, Fede MR, Dugo G. Geographical discrimination of Italian honey by multi-element analysis with a chemometric approach. J Food Compos Anal. 2015;44:25-35. Available from: https://www.sciencedirect.com/science/article/pii/S0889157515001362.
|
| 110. |
Chen H, Fa C, Chang Q, Pang G, Hu X, Lu M, Wang W. Chemometric determination of the botanical origin for Chinese honeys on the basis of mineral elements determined by ICP-MS. J Agric Food Chem. 2014;62(11):2443-2448. Available from: https://pubs.acs.org/doi/10.1021/jf405045q.
|
| 111. |
Oroian M, Amariei S, Leahu A, Gutt G. Multi-Element composition of honey as a suitable tool for its authenticity analysis. Pol J Food Nutr Sci. 2015;65(2):93-100. Available from: http://journal.pan.olsztyn.pl/Multi-Element-Composition-of-Honey-as-a-Suitable-Tool-for-Its-Authenticity-Analysis,98413,0,2.html.
|
| 112. |
Quinto M, Miedico O, Spadaccino G, Paglia G, Mangiacotti M, Li D, Centonze D, Chiaravalle AE. Characterization, chemometric evaluation, and human health-related aspects of essential and toxic elements in Italian honey samples by inductively coupled plasma mass spectrometry. Environ Sci Pollut Res Int. 2016;23(24):25374-25384. Available from: https://link.springer.com/article/10.1007%2Fs11356-016-7662-5.
|
| 113. |
Louppis AP, Karabagias IK, Papastephanou C, Badeka A. Two-way characterization of beekeepers’ honey according to botanical origin on the basis of mineral content analysis using ICP-OES implemented with multiple chemometric tools. Foods 2019;8(6):210. Available from: https://www.mdpi.com/2304-8158/8/6/210.
|
| 114. |
Nespeca M G, Vieira AL, Júnior DS, Gomes Neto J A, Ferreira EC. Detection and quantification of adulterants in honey by LIBS. Food Chem. 2020;311:125886. Available from: https://www.sciencedirect.com/science/article/pii/S0308814619320242.
|
| 115. |
Drivelos SA, Danezis GP, Halagarda M, Popek S, Georgiou CA. Geographical origin and botanical type honey authentication through elemental metabolomics via chemometrics. Food Chem. 2021;338:127936. Available from: https://www.sciencedirect.com/science/article/pii/S0308814620317982.
|
| 116. |
Zhao H, Guo B, Wei Y, Zhang B. Multi-element composition of wheat grain and provenance soil and their potentialities as fingerprints of geographical origin. J Cereal Sci. 2013;57(3):391-397. Available from: https://www.sciencedirect.com/science/article/abs/pii/S0733521013000143.
|
| 117. |
Choi I, Kang C-S, Hyun J-N, Lee C-K, Park K-G. Mineral compositions of Korean wheat cultivars. Prev Nutr Food Sci. 2013;18(3):214–217. Available from: https://www.ncbi.nlm.nih.gov/pmc/articles/PMC3892486/.
|
| 118. |
Yang W, Wang D, Wang M, Zhou F, Huang J, Xue M, Dinh QT, Liang D. Heavy metals and associated health risk of wheat grain in a traditional cultivation area of Baoji, Shaanxi, China. Environ Monit Assess. 2019;191(7):428. Available from: https://link.springer.com/article/10.1007%2Fs10661-019-7534-9.
|
| 119. |
Yasui A, Shindoh K. Determination of the geographic origin of brown-rice with trace-element composition. Bunseki Kagaku 2000;49(6):405-410. Available from: https://www.jstage.jst.go.jp/article/bunsekikagaku/49/6/49_6_405/_article/-char/en.
|
| 120. |
Gonzálvez A, Armenta S, de la Guardia M. Geographical traceability of ‘‘Arròs de Valencia’’ rice grain based on mineral element composition. Food Chem. 2011;126(3):1254-1260. Available from: https://www.sciencedirect.com/science/article/pii/S0308814610014500.
|
| 121. |
Niu X, Xia L, Zhang X. Classification of rice according to the geographic origin based on inductively coupled plasma atomic emission spectrometry and chemometrics. In: Jin D, Lin S. (eds): Advances in Computer Science, Intelligent System and Environment. Book Series: Advan. Intellig. Soft Comput. 2011;104:433-438. Available from: https://link.springer.com/chapter/10.1007/978-3-642-23777-5_71.
|
| 122. |
Kim G, Kwak J, Choi J, Park K. Detection of nutrient elements and contamination by pesticides in spinach and rice samples using Laser-Induced Breakdown Spectroscopy (LIBS). J Agric Food Chem. 2012;60(3):718-724. Available from: https://pubs.acs.org/doi/10.1021/jf203518f.
|
| 123. |
Borges EM, Gelinski JMLN, de Oliveira Souza VC, Barbosa F Jr., Batista BL. Monitoring the authenticity of organic rice via chemometric analysis of elemental data. Food Res Inter. 2015;77(3):299-309. Available from: https://www.sciencedirect.com/science/article/abs/pii/S0963996915300545.
|
| 124. |
Chung Ill-Min, Kim J-K, Le J-K, Kim S-H. Discrimination of geographical origin of rice (Oryza sativa L.) by multielement analysis using inductively coupled plasma atomic emission spectroscopy and multivariate analysis. J Cereal Sci. 2015;65:252-259. Available from: https://www.sciencedirect.com/science/article/abs/pii/S0733521015300497.
|
| 125. |
Maione C, Batista BL, Campiglia AD, Barbosa F Jr., Barbosa RM. Classification of geographic origin of rice by data mining and inductively coupled plasma mass spectrometry. Comput Electron Agric. 2016;121:101-107. Available from: https://www.sciencedirect.com/science/article/pii/S0168169915003580.
|
| 126. |
Akin PA, Sezer B, Sanal T, Apaydin H, Koksel H, Boyaci İH. Multi-elemental analysis of flour types and breads by using laser induced breakdown spectroscopy. J Cereal Sci. 2020;92:102920. Available from: https://www.sciencedirect.com/science/article/abs/pii/S0733521019302024.
|
| 127. |
Laursen KH, Schjoerring JK, Olesen JE, Askegaard M, Helekoh U, Husted S. Multielemental fingerprinting as a tool for authentication of organic barley, faba bean, and potato. J Agric Food Chem. 2011;59(2):4385-4396. Available from: https://pubs.acs.org/doi/10.1021/jf104928r.
|
| 128. |
Huang Y, Peng L, Liu Y, Zhang Z, Lv L, Zhao G. Evaluation of essential and toxic elements concentrations in different parts of buckwheat. Czech J Food Sci. 2013;31(3):249-255. Available from: https://www.agriculturejournals.cz/publicFiles/92401.pdf.
|
| 129. |
Peng L-X, Huang Y-F, Liu Y, Zhang Z-F, Lu L-Y, Zhao G. Evaluation of essential and toxic element concentrations in buckwheat by experimental and chemometric approaches. J Integr Agric. 2014;13(8):1691-1698. Available from: https://www.sciencedirect.com/science/article/pii/S2095311913607248.
|
| 130. |
Jamali MK, Kazi TG, Arain MB, Afridi HI, Jalbani N, Sarfraz RA, Baig JA. A multivariate study: Variation in uptake of trace and toxic elements by various varieties of Sorghum bicolor L. J Hazard Mater. 2008;158(2-3):644-651. Available from: https://www.sciencedirect.com/science/article/abs/pii/S0304389408002318?via%3Dihub.
|
| 131. |
Akın PA, Sezer B, Bean SR, Peiris K, Tilley M, Apaydın H, Boyacı İH. Analysis of corn and sorghum flour mixtures using laser‐induced breakdown spectroscopy. J Sci Food Agric. 2021;101(3): 1076-1084. Available from: https://onlinelibrary.wiley.com/doi/full/10.1002/jsfa.10717.
|
| 132. |
Grembecka M, Kusiuk A, Szefer P. Application of multivariate methods to quality evaluation of rice. 3 International IUPAC Symposium on Trace Elements in Food, Rome, Italy, 1-3 April 2009; abstract book, p. 132.
|
| 133. |
Jiménez MS, Velarte R, Gomez M.T, Castillo JR. Multielement determination using on-line emulsion formation and ICP-MS/FAAS for the characterization of virgin olive oils by principal component analysis. At Spectrosc. 2004;25(1):1-12. Available from: https://www.researchgate.net/publication/262997431_Multielement_determination_using_on-line_emulsion_formation_and_ICP-MSFAAS_for_the_characterization_of_virgin_olive_oils_by_principal_component_analysis.
|
| 134. |
Benincasa C, Lewis J, Perri E, Sindona G, Tagarelli A. Determination of trace element in Italian virgin olive oils and their characterization according to geographical origin by statistical analysis. Anal Chim Acta 2007;585(2):366-370. Available from: https://www.sciencedirect.com/science/article/pii/S0003267006024561.
|
| 135. |
Camin F, Larcher R, Perini M, Bontempo L, Bertoldi D, Gagliano G, Nicolini G, Versini G. Characterisation of authentic Italian extra-virgin olive oils by stable isotope ratios of C, O and H and mineral composition. Food Chem. 2010;118(4):901-909. Available from: https://www.sciencedirect.com/science/article/pii/S0308814608005116.
|
| 136. |
Llorent-Martínez EJ, Ortega-Barrales P, Fernández-de Córdova ML, Domínguez-Vidal A, Ruiz-Medina A. Investigation by ICP-MS of trace element levels in vegetable edible oils produced in Spain. Food Chem. 2011;127(3):1257-1262. Available from: https://www.sciencedirect.com/science/article/pii/S0308814611001518.
|
| 137. |
Farmaki EG, Thomaidis NS, Minioti KS, Ioannou E, Georgiou CA, Efstathiou CE. Geographical characterization of Greek olive oils using rare earth elements content and supervised chemometric techniques. Anal Lett. 2012;45(8):920-932. Available from: https://www.tandfonline.com/doi/full/10.1080/00032719.2012.655656.
|
| 138. |
Damak F, Asano M, Baba K, Suda A, Araoka D, Wali A, Isoda H, Nakajima M, Ksibi M, Tamura K. Interregional traceability of Tunisian olive oils to the provenance soil by multielemental fingerprinting and chemometrics. Food Chem. 2019;283:656-664. Available from: https://www.sciencedirect.com/science/article/pii/S0308814619301505.
|
| 139. |
Gomez-Ariza JL, Arias-Borrego A, García-Barrer T. Combined use of total metal content and size fractionation of metal biomolecules to determine the provenance of pine nuts (Pinus pinea). Anal Bioanal Chem. 2007;388(5):1295-1302. Available from: https://link.springer.com/article/10.1007%2Fs00216-007-1331-y.
|
| 140. |
Joebstl D, Bandoniene D, Meisel T, Chatzistathis S. Identification of the geographical origin of pumpkin seed oil by the use of rare earth elements and discriminant analysis. Food Chem. 2010;123(4):1303-1309. Available from: https://www.sciencedirect.com/science/article/pii/S0308814610007119.
|
| 141. |
Bandoniene D, Zettl D, Meisel T, Maneiko M. Suitability of elemental fingerprinting for assessing the geographic origin of pumpkin (Cucurbita pepo var. styriaca) seed oil. Food Chem. 2013;136(3-4):1533-1542. Available from: https://www.sciencedirect.com/science/article/pii/S0308814612010126.
|
| 142. |
Kafaoğlu B, Fisher A, Hill S, Kara D. Chemometric evaluation of trace metal concentrations in some nuts and seeds. Food Additiv Contam Part A. 2014;31(9):1529-1538. Available from: https://www.tandfonline.com/doi/full/10.1080/19440049.2014.947331.
|
| 143. |
Bolaños D, Marchevsky EJ, Camiña JM. Elemental analysis of amaranth, chia, sesame, linen, and quinoa seeds by ICP-OES: Assessment of classification by chemometrics. Food Anal Meth. 2016;9(2):477-484. Available from: https://link.springer.com/article/10.1007/s12161-015-0217-4.
|
| 144. |
Moreda-Piñeiro J, Herbello-Hermelo P, Domínguez R, Bermejo-Barrera P, Moreda-Piñeiro A. Bioavailability assessment of essential and toxic metals in edible nuts and seeds. Food Chem. 2016;205:146-154. Available from: https://www.sciencedirect.com/science/article/pii/S030881461630348X?via%3Dihub.
|
| 145. |
Esteki M, Vander Heyden Y, Farajmand B, Kolahderazi Y. Qualitative and quantitative analysis of peanut adulteration in almond powder samples using multi-elemental fingerprinting combined with multivariate data analysis methods. Food Contr. 2017;82:31-41. Available from: https://www.sciencedirect.com/science/article/abs/pii/S0956713517303122.
|
| 146. |
Zettl D, Bandoniene D, Meisel T, Wegscheider W, Rantitsch G. Chemometric techniques to protect the traditional Austrian pumpkin seed oil. Eur J Lipid Sci Technol. 2017;119(11):1600468. Available from: https://onlinelibrary.wiley.com/doi/full/10.1002/ejlt.201600468.
|
| 147. |
Anderson KA, Magnuson BA, Tschirgi ML, Smith B. Determining the geographic origin of potatoes with trace metal analysis using statistical and neural network classifiers. J Agric Food Chem. 1999;47(4):1568-1575. Available from: https://pubs.acs.org/doi/10.1021/jf980677u.
|
| 148. |
Bibak A, Stürup S, Haahr V, Gundersen P, Gundersen V. Concentrations of 50 Major and Trace Elements in Danish Agricultural Crops Measured by Inductively Coupled Plasma Mass Spectrometry. 3. Potato (Solanum tuberosum Folva). J Agric Food Chem. 1999;47(7):2678-2684. Available from: https://pubs.acs.org/doi/10.1021/jf980606v.
|
| 149. |
Padín PM, Peña RM, García S, Iglesias R, Barro S, Herrero C. Characterization of Galician (N.W. Spain) quality brand potatoes: A Comparison study of several pattern recognition techniques. Analyst 2001;126:97-103. Available from: https://pubs.rsc.org/en/content/articlelanding/2001/AN/b007720h#!divAbstract.
|
| 150. |
Peña RM, García S, Iglesias R, Barro S, Herrero C. Authentication of Galician (N.W. Spain) quality brand potatoes using metal analysis. Classical pattern recognition techniques versus a new vector quantization-based classification procedure. Analyst 2001;126:2186-2193. Available from: https://pubs.rsc.org/en/content/articlelanding/an/2001/b107114a#!divAbstract.
|
| 151. |
Di Giacomo F, Del Signore A, Giaccio M. Determining the geographic origin of potatoes using mineral and trace element content. J Agric Food Chem. 2007;55(3):860-866. Available from: https://pubs.acs.org/doi/10.1021/jf062690h.
|
| 152. |
Galdón BR, Hernández Rodríguez L, Ríos Mesa D, Lorenzo León H, Luna Pérez N, Rodríguez Rodríguez EM, Díaz Romero C. Differentiation of potato cultivars experimentally cultivated based on their chemical composition and by applying linear discriminant analysis. Food Chem. 2012;133(4):1241-1248. Available from: https://www.sciencedirect.com/science/article/pii/S030881461101449X.
|
| 153. |
Nassar AMK, Sabally K, Kubow S, Leclerc YN, Donnelly DJ. Some Canadian-grown potato cultivars contribute to a substantial content of essential dietary minerals. J Agric Food Chem. 2012;60(18):4688-4696. Available from: https://pubs.acs.org/doi/10.1021/jf204940t.
|
| 154. |
Hernández Suárez M, Rodríguez-Rodríguez EM, Díaz Romero C. Mineral and trace element concentrations in cultivars of tomatoes. Food Chem. 2007;104(2):489-499. Available from: https://www.sciencedirect.com/science/article/pii/S0308814606009484.
|
| 155. |
Bontempo L, Camin F, Manzocco L, Nicolini G, Wehrens R, Ziller L, Larcher R. Traceability along the production chain of Italian tomato products on the basis of stable isotopes and mineral composition. Rapid Commun Mass Spectrom. 2011;25(7):899-909. Available from: https://analyticalsciencejournals.onlinelibrary.wiley.com/doi/full/10.1002/rcm.4935.
|
| 156. |
Fragni R, Trifirò A, Nucci A. Towards the development of a multi-element analysis by ICP-oa-TOF-MS for tracing the geographical origin of processed tomato products. Food Contr. 2015;48:96-101. Available from: https://www.sciencedirect.com/science/article/abs/pii/S0956713514002242.
|
| 157. |
dos Santos AMP, Caires Oliveira A, Santos Souza A, Mota de Jesus R, Ferreira SLC. Determination and evaluation of the mineral composition of Chinese cabbage (Beta vulgaris). Food Anal Meth. 2011;4(4):567-573. Available from: https://link.springer.com/article/10.1007/s12161-011-9205-5.
|
| 158. |
Bong Y-S, Shin W-J, Gautam M K, Jeong Y-J, Lee A-R, Jang C-S, Lim Y-P, Chung G-S, Lee K-S. Determining the geographical origin of Chinese cabbages using multielement composition and strontium isotope ratio analyses. Food Chem. 2012;135(4):2666-2674. Available from: https://www.sciencedirect.com/science/article/pii/S0308814612011570?via%3Dihub.
|
| 159. |
dos Santos AMPB, Lima JS, Anunciacao D, Souza AS, dos Santos DCMB, Matos GD. Determination and evaluation employing multivariate analysis of the mineral composition of broccoli (Brassica oleracea L. var. Italica). Food Anal Meth. 2013;6(3):745-752. Available from: https://link.springer.com/article/10.1007/s12161-012-9475-6.
|
| 160. |
Mottese AF, Albergamo A, Bartolomeo G, Bua GD, Rando R, De Pasquale P, Saija E, Donato D, Dugo G. Evaluation of fatty acids and inorganic elements by multivariate statistics for the traceability of the Sicilian Capparis spinosa L. J Food Compos Anal. 2018;72:66-74. Available from: https://www.sciencedirect.com/science/article/pii/S0889157518302424.
|
| 161. |
Pepi S, Sardella A, Bonazza A, Vaccaro C. Geochemical caper fingerprints as a tool for geographical origin identification. Environ Geochem Health 2018;40(4):1385-1403. Available from: https://pubmed.ncbi.nlm.nih.gov/29299859/.
|
| 162. |
Mitic VD, Stankov-Jovanovic VP, Tosic SB, Pavlovic AN, Cvetkovic JS, Dimitrijevic MV, Nikolic-Mandic SD. Chemometric approach to evaluate heavy metals’ content in Daucus carota from different localities in Serbia. Hem Ind. 2015;69(6):643-650. Available from: http://www.doiserbia.nb.rs/Article.aspx?id=0367-598X1400070M.
|
| 163. |
Magdas DA, Feher I, Dehelean A, Cristea G, Magdas TM, Puscas R, Marincaş O. Isotopic and elemental markers for geographical origin and organically grown carrots discrimination. Food Chem. 2018;267:231-239. Available from: https://www.sciencedirect.com/science/article/pii/S0308814617316655.
|
| 164. |
Bibak A, Behrens A, Stürup S, Knudsen L, Gundersen V. Concentrations of 63 major and trace elements in Danish agricultural crops measured by Inductively Coupled Plasma Mass Spectrometry. 1. Onion (Allium cepa Hysam). J Agric Food Chem. 1998;46(8):3139-3145. Available from: https://pubs.acs.org/doi/abs/10.1021/jf971103c.
|
| 165. |
Gundersen V, Bechmann IE, Behrens A, Stürup S. Comparative investigation of concentrations of major and trace elements in organic and conventional Danish agricultural crops. 1. Onions (Allium cepa Hysam) and Peas (Pisum sativum Ping Pong). J Agric Food Chem. 2000;48(12):6094-6102. Available from: https://pubs.acs.org/doi/abs/10.1021/jf0009652.
|
| 166. |
Ariyama K, Horita H, Yasui A. Application of inorganic element ratios to chemometrics for determination of the geographic origin of Welsh Onions. J Agric Food Chem. 2004;52(19):5803-5809. Available from: https://pubs.acs.org/doi/10.1021/jf049333w.
|
| 167. |
Ariyama K, Horita H, Yasui A. Chemometric techniques on inorganic elements composition for the determination of the geographic origin of welsh onions. Anal Sci 2004;20(5):871-877. Available from: https://www.jstage.jst.go.jp/article/analsci/20/5/20_5_871/_article.
|
| 168. |
Ariyama K, Aoyama Y, Mochizuki A, Homura Y, Kadokura M, Yasui A. Determination of the geographic origin of onions between three main production areas in Japan and other countries by mineral composition. J Agric Food Chem. 2007;55(2):347-354. Available from: https://pubs.acs.org/doi/10.1021/jf062613m.
|
| 169. |
Galdon BR, Gonzalez RO, Rodrıguez ER, Romero CD. Comparison of mineral and trace element contents in onion cultivars (Allium cepa L.). J Sci Food Agric. 2008;88(9):1554-1561. Available from: https://onlinelibrary.wiley.com/doi/full/10.1002/jsfa.3250.
|
| 170. |
Furia E, Naccarato A, Sindona G, Stabile G, Tagarelli A. Multielement fingerprinting as a tool in origin authentication of PGI Food Products: Tropea Red Onion. J Agric Food Chem. 2011;59(15):8450-8457. Available from: https://pubs.acs.org/doi/10.1021/jf201556e.
|
| 171. |
Camargo AB, Resnizky S, Marchevsky EJ, Luco JM. Use of the Argentinean garlic (Allium sativum L.) germplasm mineral profile for determining geographic origin. J Food Compos Anal. 2010;23(6):586-591. Available from: https://www.sciencedirect.com/science/article/pii/S0889157510000724.
|
| 172. |
Vadalà R, Mottese AF, Bua GD, Salvo A, Mallamace D, Corsaro C, Vasi S, Giofrè SV, Alfa M, Cicero N, Dugo G. Statistical analysis of mineral concentration for the geographic identification of garlic samples from Sicily (Italy), Tunisia and Spain. Foods 2016;5(1):1-11. Available from: https://www.ncbi.nlm.nih.gov/pmc/articles/PMC5224572/.
|
| 173. |
D'Archivio AA, Foschi M, Aloia R, Maggi MA, Rossi L, Ruggieri F. Geographical discrimination of Red Garlic (Allium sativum L.) produced in Italy by means of multivariate statistical analysis of ICP-OES data. Food Chem. 2019;275:333-338. Available from: https://www.sciencedirect.com/science/article/pii/S0308814618316601.
|
| 174. |
Bozokalfa MK, Yağmur B, Aşçıoğul TK, Eşiyok D. Diversity in nutritional composition of Swiss chard (Beta vulgaris subsp. L. var. cicla) accessions revealed by multivariate analysis. Plant Gen Res. 2011;9(4):557-566. Available from: https://www.cambridge.org/core/journals/plant-genetic-resources/article/abs/diversity-in-nutritional-composition-of-swiss-chard-beta-vulgaris-subsp-l-var-cicla-accessions-revealed-by-multivariate-analysis/E9CF715A0A9AAE2BDAA8806AE55C6619.
|
| 175. |
Santos WPC, Castro JT, Bezerra MA, Korn MGA. Application of multivariate optimization in the development of an ultrasound-assisted extraction procedure for multielemental determination in bean seeds samples using ICP OES. Microchem J. 2009; 91(2):153-158. Available from: https://www.sciencedirect.com/science/article/pii/S0026265X08001276.
|
| 176. |
Drivelos SA, Higgins K, Kalivas JH, Haroutounian SA, Georgiou CA. Data fusion for food authentication. Combining rare earth elements and trace metals to discriminate “Fava Santorinis” from other yellow split peas using chemometric tools. Food Chem. 2014;165:316-322. Available from: https://www.sciencedirect.com/science/article/pii/S0308814614004749.
|
| 177. |
Foschi M, D'Archivio AA, Rossi L. Geographical discrimination and authentication of lentils (Lens culinaris Medik.) by ICP-OES elemental analysis and chemometrics. Food Contr. 2020;118:107438. Available from: https://www.sciencedirect.com/science/article/abs/pii/S0956713520303546.
|
| 178. |
Gergen I, Harmanescu M. Application of principal component analysis in the pollution assessment with heavy metals of vegetable food chain in the old mining areas. Chem Cent J. 2012;6(1):156. Available from: https://www.ncbi.nlm.nih.gov/pmc/articles/PMC3575243/.
|
| 179. |
Mitic V, Stankov-Jovanovic V, Cvetkovic J, Dimitrijevic M, Ilic M, Nikolic-Mandic S. Application of multivariate statistical approach to identify element sources in parsley (Petroselinum crispum). Toxic Environ Chem. 2015;97(6):754-765. Available from: https://www.tandfonline.com/doi/full/10.1080/02772248.2015.1068315.
|
| 180. |
Brunner M, Katona R, Stefánka Z, Prohaska T. Determination of the geographical origin of processed spice using multielement and isotopic pattern on the example of Szegedi paprika. Eur Food Res Technol. 2010;231(4):623-634. Available from: https://link.springer.com/article/10.1007/s00217-010-1314-7.
|
| 181. |
Naccarato A, Furia E, Sindona G, Tagarelli A. Multivariate class modeling techniques applied to multielement analysis for the verification of the geographical origin of Chili Pepper. Food Chem. 2016;206:217-222. Available from: https://www.sciencedirect.com/science/article/pii/S0308814616304411?via%3Dihub.
|
| 182. |
Hidalgo MJ, Fechner DC, Marchevsky EJ, Pellerano RG. Determining the geographical origin of Sechium edule fruits by multielement analysis and advanced chemometric techniques. Food Chem. 2016;210:228-234. Available from: https://www.sciencedirect.com/science/article/pii/S0308814616306483?via%3Dihub.
|
| 183. |
Oliveira AC, dos Santos VS, dos Santos DC, Carvalho RDS, Santos Souza A. Costa Ferreira SL. Determination of the mineral composition of Caigua (Cyclanthera pedata) and evaluation using multivariate analysis. Food Chem. 2014;152:619-623. Available from: https://www.sciencedirect.com/science/article/pii/S0308814613018773.
|
| 184. |
Nakamura S, Suzuki T, Horita H, Nakano A. Detection of falsely labeled Taro in Japan by elemental analysis: improvement of discrimination ability using a sampling plan. Food Sci Technol Res. 2012;18(5):723-733. Available from: https://www.jstage.jst.go.jp/article/fstr/18/5/18_723/_article/-char/en.
|
| 185. |
Liu X, Xue C, Wang Y-M, Li Z, Xue Y, Xu J. The classification of sea cucumber (Apostichopus japonicus) according to region of origin using multi-element analysis and pattern recognition techniques. Food Contr. 2012;23(2):522-527. Available from: https://www.sciencedirect.com/science/article/abs/pii/S0956713511003331.
|
| 186. |
Grembecka M, Gurzyńska A, Dybek K, Szefer P. The applicability of chemometric techniques in assessing the differences in quality of vegetable products. 3 International IUPAC Symposium on Trace Elements in Food, Rome, Italy, 1-3 April 2009; abstract book, p. 131.
|
| 187. |
Coelho I, Matos AS, Teixeira R, Nascimento A, Bordado J, Donard O, Castanheira I. Combining multielement analysis and chemometrics to trace the geographical origin of Rocha pear. J Food Compos Anal. 2019;77:1-8. Available from: https://www.sciencedirect.com/science/article/pii/S0889157518312717.
|
| 188. |
Zhang J, Nie J, Kuang L, Shen Y, Zheng H, Zhang H, Farooq S, Asim S. Geographical origin of Chinese apples based on multiple element analysis. J Sci Food Agric. 2019;99(14):6182-6190. Available from: https://onlinelibrary.wiley.com/doi/full/10.1002/jsfa.9890.
|
| 189. |
Potortì AG, Di Bella G, Mottese AF, Bua GD, Fede MR, Sabatino G, Salvo A, Somma R, Dugo G, Turco VL. Traceability of protected geographical indication (PGI) Interdonato lemon pulps by chemometric analysis of the mineral composition. J Food Compos Anal. 2018;69:122-128. Available from: https://www.sciencedirect.com/science/article/pii/S0889157518300632.
|
| 190. |
Rao G, Huang L, Liu M, Chen T, Chen J, Luo Z, Xu F, Xu X, Yao M. Identification of Huanglongbing-infected navel oranges based on laser-induced breakdown spectroscopy combined with different chemometric methods. Appl Opt 2018;57(9):8738-8742. Available from: https://pubmed.ncbi.nlm.nih.gov/30461952/.
|
| 191. |
Yan J, Liu J, Xiong Y, Qin W, Tang C. Identification of the geographical origins of pomelos using multielement fingerprinting. J Food Sci. 2015;80(2):1-6. Available from: https://onlinelibrary.wiley.com/doi/full/10.1111/1750-3841.12746.
|
| 192. |
Mir-Marqués A, Domingo A, Cervera ML, de la Guardia M. Mineral profile of kaki fruits (Diospyros kaki L.). Food Chem. 2015;172:291-297. Available from: https://www.sciencedirect.com/science/article/pii/S0308814614014435.
|
| 193. |
Pellerano RG, Mazza SS, Marigliano RA, Marchevsky EJ. Multielement analysis of Argentinean lemon juices by instrumental neutronic activation analysis and their classification according to geographical origin. J Agric Food Chem. 2008;56(13):5222–5225. Available from: https://pubs.acs.org/doi/abs/10.1021/jf073555n.
|
| 194. |
Gaiad JE, Hidalgo MJ, Villafañe RN, Marchevsky EJ, Pellerano RG. Tracing the geographical origin of Argentinean lemon juices based on trace element profiles using advanced chemometric techniques. Microchem J. 2016;129:243-248. Available from: https://www.sciencedirect.com/science/article/pii/S0026265X16301382.
|
| 195. |
Borges EM, Volmer DA, Brandelero E, Gelinski JMLN, Gallimberti M., Barbosa F. Jr. Monitoring the authenticity of organic grape juice via chemometric analysis of elemental data. Food Anal Meth. 2016;9(2):362-369. Available from: https://link.springer.com/article/10.1007/s12161-015-0191-x.
|
| 196. |
Maione C, de Paula ES, Gallimberti M, Batista BL, Campiglia AD, Barbosa FJr, Barbosa RM. Comparative study of data mining techniques for the authentication of organic grape juice based on ICP-MS analysis. Expert Syst Appl. 2016;49:60-73. Available from: https://www.sciencedirect.com/science/article/pii/S0957417415007903.
|
| 197. |
Simpkins WA, Louie H, Wu M, Harrison M, Goldberg D. Trace elements in Australian orange juice and other products. Food Chem. 2000;71(4):423-433. Available from: https://www.sciencedirect.com/science/article/pii/S0308814600001503.
|
| 198. |
Marcos A, Fisher A, Rea G, Hill SJ. Preliminary study using trace element concentrations and a chemometrics approach to determine the geographical origin of tea. J Anal At Spectrom. 1998;13:521-525. Available from: https://pubs.rsc.org/en/content/articlelanding/1998/JA/a708658j#!divAbstract.
|
| 199. |
Wong MH, Zhang ZQ, Wong JWC, Lan CY. Trace metal contents (Al, Cu and Zn) of tea: Tea and soil from two tea plantations, and tea products from different provinces of China. Environ Geochem Health. 1998;20(2):87-94. Available from: https://link.springer.com/article/10.1023/A:1006545825302.
|
| 200. |
Fernández-Cáceres PL, Martín MJ, Pablos F, González AG. Differentiation of tea (Camellia sinensis) varieties and their geographical origin according to their metal content. J Agric Food Chem. 2001;49(10):4775-4779. Available from: https://pubs.acs.org/doi/10.1021/jf0106143.
|
| 201. |
Herrador MA, González AG. Pattern recognition procedures for differentiation of Green, Black and Oolong teas according to their metal content from inductively coupled plasma atomic emission spectrometry. Talanta 2001;53(6):1249-1257. Available from: https://www.sciencedirect.com/science/article/pii/S0039914000006196?via%3Dihub.
|
| 202. |
Moreda-Piñeiro A, Marcos A, Fisher A, Hill SJ. Evaluation of the effect of data pre-treatment procedures on classical pattern recognition and principal components analysis: A case study for the geographical classification of tea. J Environ Monit. 2001;3:352-360. Available from: https://pubs.rsc.org/en/content/articlelanding/2001/em/b103658k#!divAbstract.
|
| 203. |
Moreda-Piñeiro A, Fisher A, Hill SJ. The classification of tea according to region of origin using pattern recognition techniques and trace metal data. J Food Compos Anal. 2003;16(2):195-211. Available from: https://www.sciencedirect.com/science/article/pii/S0889157502001631.
|
| 204. |
Fernández PL, Pablos F, Martin MJ, González AG. Multi-element analysis of tea beverages by inductively coupled plasma atomic emission spectrometry. Food Chem. 2002;76(4):483-489. Available from: https://www.sciencedirect.com/science/article/pii/S0308814601003120.
|
| 205. |
Chen Y, Yu M, Xu J, Chen X, Shi J. Differentiation of eight tea (Camellia sinensis) cultivars in China by elemental fingerprint of their leaves. J Sci Food Agric. 2009;89(14):2350-2355. Available from: https://onlinelibrary.wiley.com/doi/full/10.1002/jsfa.3716.
|
| 206. |
McKenzie JS, Jurado JM, de Pablos F. Characterisation of tea leaves according to their total mineral content by means of probabilistic neural networks. Food Chem. 2010;123(3):859-864. Available from: https://www.sciencedirect.com/science/article/pii/S0308814610005674.
|
| 207. |
Mbaye M, Traoré A, Ndao AS, Wagué A. Classification of tea consumed in Senegal using XRF techniques and chemometric based on their country of origin. African J Agric Res. 2013;8(44):5522-5529. Available from: https://academicjournals.org/article/article1384510091_Mbaye%20et%20al.pdf.
|
| 208. |
Marcelo MCA, Martins CA, Pozebon D, Dressler VL, Ferrão MF. Classification of yerba mate (Ilex paraguariensis) according to the country of origin based on element concentrations. Microchem J. 2014;117:164-171. Available from: https://www.sciencedirect.com/science/article/pii/S0026265X14001301.
|
| 209. |
Paz-Rodríguez B, Domínguez-González MR, Aboal-Somoza M, Bermejo-Barrera P. Application of High Resolution-Continuum Source Flame Atomic Absorption Spectrometry (HR-CS FAAS): Determination of trace elements in tea and tisanes. Food Chem. 2015;170:492-500. Available from: https://www.sciencedirect.com/science/article/pii/S0308814614012126?via%3Dihub.
|
| 210. |
Brzezicha-Cirocka J, Grembecka M, Szefer P. Oxalate, magnesium and calcium content in selected kinds of tea: impact on human health. Eur. Food Res. Technol. 2016;242(3):383-389. Available from: https://link.springer.com/article/10.1007/s00217-015-2548-1.
|
| 211. |
Brzezicha-Cirocka J, Grembecka M, Szefer P. Analytical assessment of bio- and toxic elements distribution in Pu-erh and fruit teas in view of chemometric approach. Biol. Trace Elem. Res. 2016;174(1):240-250. Available from: https://link.springer.com/article/10.1007/s12011-016-0669-4.
|
| 212. |
Brzezicha-Cirocka J, Grembecka M, Ciesielski T, Flaten TP, Szefer P. Evaluation of macro- and microelement levels in black tea in view of its geographical origin. Biol. Trace Elem. Res. 2017;176(2):429-441. Available from: https://pubmed.ncbi.nlm.nih.gov/27637916/.
|
| 213. |
Ma G, Zhang Y, Zhang J, Wang G, Chen L, Zhang M, Liu T, Liu X, Lu C. Determining the geographical origin of Chinese green tea by linear discriminant analysis of trace metals and rare earth elements: Taking Dongting Biluochun as an example. Food Contr. 2016;59:714-720. Available from: https://www.sciencedirect.com/science/article/abs/pii/S0956713515300669.
|
| 214. |
Milani RF, Morgano MA, Cadore S. Trace elements in Camellia sinensis marketed in southeastern Brazil: Extraction from tea leaves to beverages and dietary exposure. LWT – Food Sci Technol. 2016;68:491-498. Available from: https://www.sciencedirect.com/science/article/abs/pii/S0023643815303984.
|
| 215. |
Ye X, Jin S, Wang D, Zhao F, Yu Y, Zheng D, Ye N. Identification of the origin of white tea based on mineral element content. Food Anal Meth. 2016;10(1):191-199. Available from: https://link.springer.com/article/10.1007/s12161-016-0568-5.
|
| 216. |
Lou Y-X, Fu X-S, Yu XP, Ye Z-H, Cui H-F, Zhang Y-F. Stable isotope ratio and elemental profile combined with Support Vector Machine for provenance discrimination of Oolong Tea (Wuyi-Rock Tea). J Anal Meth Chem. 2017;2017:5454231. Available from: https://www.ncbi.nlm.nih.gov/pmc/articles/PMC5394888/.
|
| 217. |
Zhao H, Zhang S, Zhang Z. Relationship between multi-element composition in tea leaves and in provenance soils for geographical traceability. Food Contr. 2017;76:82-87. Available from: https://www.sciencedirect.com/science/article/abs/pii/S0956713517300166.
|
| 218. |
Zhao H, Yu C, Li M. Effects of geographical origin, variety, season and their interactions on minerals in tea for traceability. J Food Compos Anal. 2017;63:15-20. Available from: https://www.sciencedirect.com/science/article/pii/S0889157517301849.
|
| 219. |
Zhao H, Yang Q. The suitability of rare earth elements for geographical traceability of tea leaves. J Sci Food Agric. 2019;99(14):6509-6514. Available from: https://onlinelibrary.wiley.com/doi/full/10.1002/jsfa.9930.
|
| 220. |
Zhao H, Zhao F. The authenticity identification of teas (Camellia sinensis L.) of different seasons according to their multi-elemental fingerprints. Int J Food Sci Techn. 2019;54:249-255. Available from: https://ifst.onlinelibrary.wiley.com/doi/pdf/10.1111/ijfs.13935.
|
| 221. |
Malinowska E, Inkielewicz I, Czarnowski W, Szefer P. Assessment of fluoride concentration and daily intake by human from tea and herbal infusions. Food Chem Toxicol. 2008;46(3):1055-1061. Available from: https://www.sciencedirect.com/science/article/pii/S027869150700511X.
|
| 222. |
Zhang X, Wu H, Huang X, Zhang C. Establishment of element fingerprints and application to geographical origin identification of Chinese Fenghuangdancong Tea by ICP-MS. Food Sci Techn Res. 2018;24(4):599-608. Available from: https://www.jstage.jst.go.jp/article/fstr/24/4/24_599/_article/-char/en.
|
| 223. |
Idrees M, Jan FA, Hussain S, Salam A. Heavy metals level, health risk assessment associated with contamination of Black Tea; A case study from Khyber Pakhtunkhwa (KPK), Pakistan. Biol Trace Elem Res. 2020;198(1):344-349. Available from: https://link.springer.com/article/10.1007/s12011-020-02059-1.
|
| 224. |
Liu H‐l, Zeng Y‐T, Zhao X, Tong H‐R. Improved geographical origin discrimination for tea using ICP‐MS and ICP‐OES techniques in combination with chemometric approach. J Sci Food Agric. 2020;100(8):3507-3516. Available from: https://onlinelibrary.wiley.com/doi/full/10.1002/jsfa.10392.
|
| 225. |
Liu H, Meng Q, Zhao X, Ye Y, Tong H. Inductively coupled plasma mass spectrometry (ICP-MS) and inductively coupled plasma optical emission spectrometer (ICP-OES)-based discrimination for the authentication of tea. Food Contr. 2021;123:107735. Available from: https://www.sciencedirect.com/science/article/abs/pii/S0956713520306514.
|
| 226. |
Liu H, Zeng Y, Yan J, Huang R, Zhao X, Zheng X, Mo M, Tan S, Tong H. C N H O and mineral element stable isotope ratio analysis for authentication in tea. J Food Compos Anal 2020;91:103513. Available from: https://www.sciencedirect.com/science/article/pii/S0889157519318976.
|
| 227. |
Liu H-L, Zeng Y-T, Zhao X, Ye Y-L, Wang B., Tong H.-R. Monitoring the authenticity of pu'er tea via chemometric analysis of multielements and stable isotopes. Food Res Int. 2020;136:109483. Available from: https://www.sciencedirect.com/science/article/abs/pii/S0963996920305081.
|
| 228. |
Vargas Motta AC, Barbosa JZ, Magri E, Pedreira GQ, Santin D, Prior SA, Consalter R, Young SD, Broadley MR, Benedetti EL. Elemental composition of yerba mate (Ilex paraguariensis A.St.-Hil.) under low input systems of southern Brazil. Sci Total Environ. 2020;736:139637. Available from: https://www.sciencedirect.com/science/article/abs/pii/S0048969720331570.
|
| 229. |
Krivan V, Barth P, Morales AF. Multielement analysis of green coffee and its possible use for the determination of origin. Mikrochim Acta 1993;110(4):217-236. Available from: https://link.springer.com/article/10.1007/BF01245106.
|
| 230. |
Martı́n MJ, Pablos F, González AG. Application of pattern recognition to the discrimination of roasted coffees. Anal Chim Acta. 1996;320(2-3):191-197. Available from: https://www.sciencedirect.com/science/article/pii/0003267095005501.
|
| 231. |
Martı́n MJ, Pablos F, González AG. Characterization of green coffee varieties according to their metal content. Anal Chim Acta 1998;358(2):177-183. Available from: https://www.sciencedirect.com/science/article/pii/S0003267097006107.
|
| 232. |
Martı́n MJ, Pablos F, González AG. Characterization of arabica and robusta roasted coffee varieties and mixture resolution according to their metal content. Food Chem. 1999;66(3):365-370. Available from: https://www.sciencedirect.com/science/article/pii/S0308814699000928.
|
| 233. |
dos Santos EJ, de Oliveira E. Determination of mineral nutrients and toxic elements in Brazilian soluble coffee by ICP-AES. J Food Compos Anal. 2001;14(5):523-531. Available from: https://www.sciencedirect.com/science/article/pii/S0889157501910129.
|
| 234. |
Anderson KA, Smith BW. Chemical profiling to differentiate geographic growing origins of coffee. J Agric Food Chem. 2002;50(7):2068-2075. Available from: https://pubs.acs.org/doi/10.1021/jf011056v.
|
| 235. |
Fernandes AP, Santos MC, Lemos SG, Ferreira MMC, Nogueira ARA, Nóbrega JA. Pattern recognition applied to mineral characterization of Brazilian coffees and sugar-cane spirits. Spectrochim Acta Part B. 2005;60(5):5717-724. Available from: https://www.sciencedirect.com/science/article/pii/S0584854705000315.
|
| 236. |
Filho VRA, Polito WL, Gomes Neto JA. Comparative studies of the sample decomposition of green and roasted coffee for determination of nutrients and data exploratory analysis. J Braz Chem Soc. 2007;18(1):47-53. Available from: http://www.scielo.br/scielo.php?script=sci_arttext&pid=S0103-50532007000100005.
|
| 237. |
Grembecka M, Malinowska E, Szefer P. Differentiation of market coffee and its infusions in view of their mineral composition. Sci. Total Environ. 2007;383(1-3):59-69. Available from: https://pubmed.ncbi.nlm.nih.gov/17560631/.
|
| 238. |
Akamine T, Otaka A, Hokura A, Ito Y, Nakai I. Determination of trace elements in coffee beans by XRF spectrometer equipped with polarization optics and its application to identification of their production area. Bunseki Kagaku 2010;59(10):863–871. Available from: https://www.jstage.jst.go.jp/article/bunsekikagaku/59/10/59_10_863/_article/-char/en.
|
| 239. |
Muñiz-Valencia R , Jurado JM, Ceballos-Magaña SG, Alcázar A, Reyes J, Muñiz-Valencia R. Geographical differentiation of green coffees according to their metal content by means of supervised pattern recognition techniques. Food Anal Meth. 2013;6(5):1271-1277. Available from: https://link.springer.com/article/10.1007/s12161-012-9538-8.
|
| 240. |
Valentin JL, Watling RJ. Provenance establishment of coffee using solution ICP-MS and ICP-AES. Food Chem. 2013;141(1):98-104. Available from: https://www.sciencedirect.com/science/article/pii/S0308814613002641?via%3Dihub.
|
| 241. |
Barbosa RM, Batista BL, Varrique RM, Coelho VA, Campiglia AD, Barbosa FJr. The use of advanced chemometric techniques and trace element levels for controlling the authenticity of organic coffee. Food Res Inter. 2014;61:246-251. Available from: https://www.sciencedirect.com/science/article/abs/pii/S0963996913004262.
|
| 242. |
Liu H-C, You C-F, Chen C-Y, Liu Y-C, Chung M-T. Geographic determination of coffee beans using multi-element analysis and isotope ratios of boron and strontium. Food Chem. 2014;142:439-445. Available from: https://www.sciencedirect.com/science/article/pii/S030881461301011X?via%3Dihub.
|
| 243. |
Oliveira M, Ramos S, Delerue-Matos C, Morais S. Espresso beverages of pure origin coffee: Mineral characterization, contribution for mineral intake and geographical discrimination. Food Chem. 2015;177:330-338. Available from: https://www.sciencedirect.com/science/article/pii/S0308814615000631.
|
| 244. |
Szymczycha-Madeja A, Welna M, Pohl P. Simplified multi-element analysis of ground and instant coffees by ICP-OES and FAAS Part A Chemistry, analysis, control, exposure and risk assessment. Food Additiv Contam Part A. 2015;32(9):1488-1500. Available from: https://www.tandfonline.com/doi/full/10.1080/19440049.2015.1067928.
|
| 245. |
Habte G, Hwang IM, Kim JS, Hong JH, Hong Y S, Choi JY, Nho EY, Jamila N, Khan N , Kim KS. Elemental profiling and geographical differentiation of Ethiopian coffee samples through inductively coupled plasma-optical emission spectroscopy (ICP-OES), ICP-mass spectrometry (ICP-MS) and direct mercury analyzer (DMA). Food Chem. 2016;212:512-520. Available from: https://www.sciencedirect.com/science/article/pii/S030881461630869X?via%3Dihub.
|
| 246. |
Mehari B, Redi-Abshiro M, Chandravanshi BS, Combrinck S, McCrindle R. Characterization of the cultivation region of Ethiopian coffee by elemental analysis. Anal Lett. 2016;49(15):2474-2489. Available from: https://www.tandfonline.com/doi/full/10.1080/00032719.2016.1151023.
|
| 247. |
Pohl P, Szymczycha-Madeja A, Stelmach E, Welna M. Differentiation of roasted and soluble coffees through physical fractionation of selected essential and nonessential metals in their brews and exploratory data analysis. Talanta 2016;160:686-693. Available from: https://www.sciencedirect.com/science/article/pii/S0039914016305938?via%3Dihub.
|
| 248. |
Zhang C, Shen T, Liu F, He Y. Identification of coffee varieties using Laser-Induced Breakdown Spectroscopy and chemometrics. Sensors 2018;18(1):95. Available from: https://www.mdpi.com/1424-8220/18/1/95.
|
| 249. |
Al-Jaf SH, Saydam S. Comparison of metal content of coffee samples grown in different countries by Inductively Coupled Plasma Optical Emission Spectroscopy. Celal Bayar University J Sci. 2019;15(1):35-43. Available from: https://dergipark.org.tr/en/download/article-file/674245.
|
| 250. |
Cloete KJ, Šmit Ž, Minnis-Ndimba R, Vavpetič P, du Plessis A, le Roux SG, Pelicon P. Physico-elemental analysis of roasted organic coffee beans from Ethiopia, Colombia, Honduras, and Mexico using X-ray micro-computed tomography and external beam particle induced X-ray emission. Food Chem. 2019;2:100032. Available from: https://www.sciencedirect.com/science/article/pii/S2590157519300343.
|
| 251. |
Worku M, Upadhayay HR, Latruwe K, Taylor A, Blake W, Vanhaecke F, Duchateau L, Boeckx P. Differentiating the geographical origin of Ethiopian coffee using XRF- and ICP-based multi-element and stable isotope profiling. Food Chem. 2019;290:295-307. Available from: https://www.sciencedirect.com/science/article/pii/S030881461930620X.
|
| 252. |
Endaye M, Atlabachew M, Mehari B, Alemayehu M, Mengistu DA, Kerisew B. Combining multi-element analysis with statistical modeling for tracing the origin of green coffee beans from Amhara region, Ethiopia. Biol Trace Elem Res. 2020;195(2):669-678. Available from: https://link.springer.com/article/10.1007%2Fs12011-019-01866-5.
|
| 253. |
Voica C, Feher I, Iordache AM, Cristea G, Dehelean A, Magdas DA, Mirel V. Multielemental analysis of coffee by inductively coupled plasma-mass spectrometry. Anal Lett. 2016;49(16):2627-2643. Available from: https://www.tandfonline.com/doi/full/10.1080/00032719.2015.1116003.
|
| 254. |
Bitter NQ, Fernandez DP, Driscoll AW, Howa JD, Ehleringer JR. Distinguishing the region-of-origin of roasted coffee beans with trace element ratios. Food Chem. 2020;320:126602. Available from: https://www.sciencedirect.com/science/article/pii/S0308814620304647?via%3Dihub.
|
| 255. |
Awadallah RM, Ismail SS, Mohamed AE. Application of multi-element clustering techniques of five Egyptian industrial sugar products. J Radioanal Nucl Chem. 1995;196(2):377-385. Available from: https://link.springer.com/article/10.1007/BF02038058.
|
| 256. |
Nunes LC, Braga JWB., Trevizan LC, Souza PF, Carvalho GGA, Santos DJr, Poppi RJ, Krug FJ. Optimization and validation of a LIBS method for the determination of macro and micronutrients in sugar cane leaves. J Anal At Spectrom. 2010;25:1453-1460. Available from: https://pubs.rsc.org/en/content/articlelanding/2010/ja/c003620j/unauth.
|
| 257. |
Rodushkin I, Baxter DC, Engstro E, Hoogewerff J, Horn P, Papesch W, Watling J, Latkoczy C, van der Peijl G, Berends-Montero S, Ehleringer J, Zdanowicz V. Elemental and isotopic characterization of cane and beet sugars. J Food Compos Anal. 2011;24(1):70-78. Available from: https://www.sciencedirect.com/science/article/pii/S0889157510002255.
|
| 258. |
Grembecka M, Szefer P. Differentiation of confectionery products based on mineral composition. Food Anal Meth. 2012;5(2):250-259. Available from: https://link.springer.com/article/10.1007/s12161-011-9234-0.
|
| 259. |
Barbosa RM, Batista BL, Barião CV, Varrique RM, Coelho VA, Campiglia AD, Barbosa FJr. A simple and practical control of the authenticity of organic sugarcane samples based on the use of machine-learning algorithms and trace elements determination by inductively coupled plasma mass spectrometry. Food Chem. 2015;184:154-159. Available from: https://www.sciencedirect.com/science/article/pii/S0308814615003490?via%3Dihub.
|
| 260. |
Andrade DF, Guedes WN, Pereira FMV. Detection of chemical elements related to impurities leached from raw sugarcane: use of laser-induced breakdown spectroscopy (LIBS) and chemometrics. Microchem J. 2018;137:443-448. Available from: https://www.sciencedirect.com/science/article/pii/S0026265X17311062.
|
| 261. |
Guedes WN, Pereira FMV. Classifying impurity ranges in raw sugarcaneusing laser-induced breakdown spectroscopy (LIBS) and sum fusion across a tuning parameter window. Microchem J. 2018;143:331-336. Available from: https://www.sciencedirect.com/science/article/pii/S0026265X18308671.
|
| 262. |
de Carvalho GGA, Moros J, Santos DJr, Krug FJ, Laserna JJ. Direct determination of the nutrient profile in plant materials by femtosecond laser-induced breakdown spectroscopy. Anal Chim Acta 2015;876:26-38. Available from: https://www.sciencedirect.com/science/article/pii/S0003267015003499.
|
| 263. |
Pedro NAR, De Oliveira E, Cadore S. Study of the mineral content of chocolate flavoured bevarages. Food Chem. 2006;95(1):94-100. Available from: https://www.sciencedirect.com/science/article/pii/S0308814605000361.
|
| 264. |
Bertoldi D, Camin ABF, Caligiani A, Larcher R. Multielemental fingerprinting and geographic traceability of Theobroma cacao beans and cocoa products. Food Contr. 2016;65:46-53. Available from: https://www.sciencedirect.com/science/article/abs/pii/S0956713516300147.
|
| 265. |
Junior AM, Maione C, Barbosa RM, Gallimberti M, Paulelli ACC, Segura F, Souza VCO, Batista BL, Barbosa F. Elemental fingerprint profiling with multivariate data analysis to classify organic chocolate samples. J Chemometr. 2018;32(8);e3036. Available from: https://analyticalsciencejournals.onlinelibrary.wiley.com/doi/full/10.1002/cem.3036.
|
| 266. |
Kruszewski B, Obiedziński MW. Multivariate analysis of essential elements in raw cocoa and processed chocolate mass materials from three different manufacturers. LWT - Food Sci Technol. 2018,98:113-123. Available from: https://www.sciencedirect.com/science/article/abs/pii/S0023643818306832.
|
| 267. |
Vanderschueren R, Montalvo D, De Ketelaere B, Delcour JA, Smolders E. The elemental composition of chocolates is related to cacao content and origin: A multi-element fingerprinting analysis of single origin chocolates. J Food Compos Anal. 2019;83:103277. Available from: https://www.sciencedirect.com/science/article/pii/S0889157519306143.
|
| 268. |
Cocchi L, Vescovi L, Petrini LE, Petrini O. Heavy metals in edible mushrooms in Italy. Food Chem. 2006;98(2):277-284. Available from: https://www.sciencedirect.com/science/article/pii/S0308814605005108.
|
| 269. |
Chudzyński K, Falandysz J. Multivariate analysis of elements content of Larch Bolete (Suillus grevillei) mushroom. Chemosphere 2008;73(8):1230-1239. Available from: https://www.sciencedirect.com/science/article/abs/pii/S0045653508009569.
|
| 270. |
Chudzyński K, Jarzyńska G, Falandysz J. Cadmium, lead and some other trace elements in Larch Bolete mushrooms (Suillus grevillei) (Klotzsch) Sing., collected from the same site over two years. Food Additiv Contamin Part B 2013;6(4):249-253. Available from: https://www.tandfonline.com/doi/full/10.1080/19393210.2013.807881.
|
| 271. |
Falandysz J, Kunito T, Kubota R, Bielawski L, Frankowska A, Falandysz J, Tanabe S. Multivariate characterization of elements accumulated in King Bolete Boletus edulis mushroom at lowland and high mountain regions. J Environ Sci Health A 2008;43(14):1692-1699. Available from: https://pubmed.ncbi.nlm.nih.gov/18988107/.
|
| 272. |
Falandysz J, Zhang J, Wang Y-Z, Saba M, Krasińska G, Wiejak A, Tao Li. Evaluation of mercury contamination in fungi Boletus species from Latosols, Lateritic Red Earths, and Red and Yellow Earths in the Circum-Pacific Mercuriferous Belt of Southwestern China. PLoS ONE 2015;10(11):e0143608. Available from: https://journals.plos.org/plosone/article?id=10.1371/journal.pone.0143608.
|
| 273. |
Falandysz J, Chudzińska M, Barałkiewicz D, Drewnowska M, Hanć A. Toxic elements and bio-metals in Cantharellus mushrooms from Poland and China. Environ Sci Pollut Res. 2017;24(12):11472-11482. Available from: https://link.springer.com/article/10.1007%2Fs11356-017-8554-z.
|
| 274. |
Falandysz J, Sapkota A, Dryżałowska A, Mędyk M, Feng X. Analysis of some metallic elements and metalloids composition and relationships in parasol mushroom Macrolepiota procera. Environ Sci Pollut Res. 2017;24(18):15528-15537. Available from: https://www.ncbi.nlm.nih.gov/pmc/articles/PMC5487902/.
|
| 275. |
Pająk M, Gąsiorek M, Jasik M, Halecki W, Otremba K, Pietrzykowski M. Risk assessment of potential food chain threats from edible wild mushrooms collected in forest ecosystems with heavy metal pollution in Upper Silesia, Poland. Forests. 2020;11(12):1240. Available from: https://www.mdpi.com/1999-4907/11/12/1240.
|
| 276. |
Drewnowska M, Falandysz J. Investigation on mineral composition and accumulation by popular edible mushroom common chanterelle (Cantharellus cibarius). Ecotox Environ Safety. 2015;113:9-17. Available from: https://www.sciencedirect.com/science/article/abs/pii/S0147651314005405.
|
| 277. |
Kojta A, Krasińska G, Falandysz J. Mineral composition and heavy metal accumulation capacity of Bay Bolete (Xerocomus badius) fruiting bodies collected near a former gold and copper mining area. J. Geochem Explor. 2012;121:76-82. Available from: https://www.sciencedirect.com/science/article/abs/pii/S0375674212001495.
|
| 278. |
Kojta AK, Falandysz J. Metallic elements (Ca, Hg, Fe, K, Mg, Mn, Na, Zn) in the fruiting bodies of Boletus badius. Food Chem. 2016;200:206-214. Available from: https://www.sciencedirect.com/science/article/pii/S0308814616300036?via%3Dihub.
|
| 279. |
Mleczek M, Niedzielski P, Kalač P, Budka A, Siwulski M, Gąsecka M, Rzymski P, Magdziak Z, Sobieralski K. Multielemental analysis of 20 mushroom species growing near a heavily trafficked road in Poland. Environmental Sci Pollut Res. 2016;23(16):16280-16295. Available from: https://link.springer.com/article/10.1007/s11356-016-6760-8.
|
| 280. |
Niedzielski P, Mleczek M, Budka A, Rzymski P, Siwulski M, Jasińska A, Gąsecka M, Budzyńska S. A screening study of elemental composition in 12 marketable mushroom species accessible in Poland. Eur Food Res Technol. 2017;243(10):1759-1771. Available from: https://link.springer.com/article/10.1007/s00217-017-2881-7.
|
| 281. |
Brzezicha-Cirocka J, Grembecka M, Grochowska I, Falandysz J, Szefer P. Elemental composition of selected species of mushrooms based on a chemometric evaluation. Ecotox Environ Saf. 2019;173:353-365. Available from: https://www.sciencedirect.com/science/article/abs/pii/S0147651319301861.
|
| 282. |
Wang Y, Li J, Liu H, Fan M, Wang Y. Species and geographical origins discrimination of porcini mushrooms based on FT‐IR Spectroscopy and mineral elements combined with Sparse Partial Least Square‐Discriminant Analysis. J Food Sci. 2019;84(8):2112-2120. Available from: https://onlinelibrary.wiley.com/doi/full/10.1111/1750-3841.14715.
|
| 283. |
Zsigmond AR, Kantor I, May Z, Ur I, Heberger K. Data on elemental composition of Russula cyanoxantha along an urbanization gradient in Cluj-Napoca (Romania). Data in Brief 2019;27:104572. Available from: https://www.sciencedirect.com/science/article/pii/S2352340919309278?via%3Dihub.
|
| 284. |
Buruleanu LC, Radulescu C, Georgescu A, Dulama ID, Nicolescu CM, Olteanu RL, Stanescu G. Chemometric assessment of the interactions between the metal contents, antioxidant activity, total phenolics, and flavonoids in mushrooms. Anal Lett. 2019;52(8):1195-1214. Available from: https://www.tandfonline.com/doi/full/10.1080/00032719.2018.1528268.
|
| 285. |
Nowakowski P, Markiewicz-Żukowska R, Soroczynska J, Puścion-Jakubik A, Mielcarek K, Borawska MH, Socha K. Evaluation of toxic element content and health risk assessment of edible wild mushrooms. J Food Compos Anal. 2021;96:103698. Available from: https://www.sciencedirect.com/science/article/pii/S0889157520314034.
|
| 286. |
Misund A, Frengstad B, Siewers U, Reimann Cl. Variation of 66 elements in European bottled mineral waters. Sci Total Environ. 1999;243–244: 21–41. Available from: https://www.sciencedirect.com/science/article/pii/S0048969799003071?via%3Dihub.
|
| 287. |
Versari A, Parpinello GP, Galassi S. Chemometric survey of Italian bottled mineral waters by means of their labeled physico-chemical and chemical composition. J Food Compos Anal. 2002;15(3):251-264. Available from: https://www.sciencedirect.com/science/article/pii/S0889157502910586.
|
| 288. |
Kraic F, Mocák J, Fiket Ž, Kniewald G. ICP MS analysis and classification of potable, spring, and mineral waters. Chem Pap. 2008;62(5):445-450. Available from: https://link.springer.com/article/10.2478/s11696-008-0063-6.
|
| 289. |
Bityukova L, Petersell V. Chemical composition of bottled mineral waters in Estonia. J Geochem Explor. 2010;107(3):3238-3244. Available from: https://www.sciencedirect.com/science/article/abs/pii/S0375674210001111.
|
| 290. |
Birke M, Rauch U, Lorenz H. Uranium in stream and mineral water of the Federal Republic of Germany. Environ Geochem Health 2009;31(6):693-706. Available from: https://link.springer.com/article/10.1007%2Fs10653-009-9247-4.
|
| 291. |
Birke M, Rauch U, Harazim B, Lorenz H, Glatte W. Major and trace elements in German bottled water, their regional distribution, and accordance with national and international standards. J Geochem Explor. 2010;107(3):245-271. Available from: https://www.sciencedirect.com/science/article/abs/pii/S0375674210000889.
|
| 292. |
Birke M, Reimann C, Demetriades A, Rauch U, Lorenz H, Harazim B, Glatte W. Determination of major and trace elements in European bottled mineral water – Analytical methods. J Geochem Explor. 2010;107(3):217-226. Available from: https://www.sciencedirect.com/science/article/abs/pii/S0375674210000865.
|
| 293. |
Cicchella D, Albanese S, De Vivo B, Dinelli E, Giaccio L, Lima A, Valera P. Trace elements and ions in Italian bottled mineral waters: Identification of anomalous values and human health related effects. J Geochem Explor. 2010;107(3):336-349. Available from: https://www.sciencedirect.com/science/article/abs/pii/S0375674210000609.
|
| 294. |
Demetriades A. General ground water geochemistry of Hellas using bottled water samples. J Geochem Explor. 2010;107(3):283-298. Available from: https://www.sciencedirect.com/science/article/abs/pii/S0375674210001585.
|
| 295. |
Fugedi U, Kuti L, Jordan G, Kerek B. Investigation of the hydrogeochemistry of some bottled mineral waters in Hungary. J Geochem Explor. 2010;107(3):305-316. Available from: https://www.sciencedirect.com/science/article/abs/pii/S0375674210001573.
|
| 296. |
Dinelli E, Lima A, De Vivo B, Albanese S, Cicchella D, Valera P. Hydrogeochemical analysis on Italian bottled mineral waters: Effects of geology. J Geochem Explor. 2010;107(3):317-335. Available from: https://www.sciencedirect.com/science/article/abs/pii/S0375674210000907.
|
| 297. |
Dinelli E, Lima A, Albanese S, Birke M, Cicchell D, Giaccio L, Valera P, De Vivo B. Major and trace elements in tap water from Italy. J Geochem Explor. 2012;112:54-75. Available from: https://www.sciencedirect.com/science/article/abs/pii/S0375674211001567.
|
| 298. |
Dinelli E, Lima A, Albanese S, Birke M, Cicchella D, Giaccio L, Valera P, De Vivo B. Comparative study between bottled mineral and tap water in Italy. J Geochem Explor. 2012;112:368-389. Available from: https://www.sciencedirect.com/science/article/abs/pii/S0375674211002123.
|
| 299. |
Grošelj N, van der Veer G, Tušar M, Vračko M, Novič M. Verification of the geological origin of bottled mineral water using artificial neural networks. Food Chem. 2010;118(4):941-947. Available from: https://www.sciencedirect.com/science/article/pii/S0308814608014064.
|
| 300. |
Kermanshahi KY, Tabaraki R, Karimi H, Nikorazm M, Abbasi S. Classification of Iranian bottled waters as indicated by manufacturer’s labellings. Food Chem. 2010;120(4):1218-1223. Available from: https://www.sciencedirect.com/science/article/pii/S0308814609013776.
|
| 301. |
Peh Z, Šorša A, Halamić J. Composition and variation of major and trace elements in Croatian bottled waters. J Geochem Explor. 2010;107(3):227-237. Available from: https://www.sciencedirect.com/science/article/abs/pii/S0375674210000257.
|
| 302. |
Avino P, Capannesi G, Rosada A. Ultra-trace nutritional and toxicological elements in Rome and Florence drinking waters determined by Instrumental Neutron Activation Analysis. Microchem J. 2011;9792):144-153. Available from: https://www.sciencedirect.com/science/article/pii/S0026265X10001578.
|
| 303. |
Bertoldi D, Bontempo L, Larcher R, Nicolini G, Voerkelius S, Lorenz GD, Ueckermann H, Froeschl H, J. Baxter M, Hoogewerff J, Brereton P. Survey of the chemical composition of 571 European bottled mineral waters. J Food Compos Anal. 2011;2493):376-385. Available from: https://www.sciencedirect.com/science/article/pii/S0889157510002723.
|
| 304. |
Cidu R, Frau F, Tore P. Drinking water quality: Comparing inorganic components in bottled water and Italian tap water. J Food Compos Anal. 2011;24(2):184-193. Available from: https://www.sciencedirect.com/science/article/pii/S0889157510002838.
|
| 305. |
Souza AL, Lemos SG, Naozuka J, Correia PRM, Oliveira PV. Exploring the emission intensities of ICP OES aided by chemometrics in the geographical discrimination of mineral waters. J Anal At Spectrom. 2011;26:852-860. Available from: https://pubs.rsc.org/en/Content/ArticleLanding/JA/2011/C0JA00071J#!divAbstract.
|
| 306. |
Banks D, Birke M, Flem B, Reimann C. Inorganic chemical quality of European tap-water: 1. Distribution of parameters and regulatory compliance. Appl Geochem. 2014;59:200-210. Available from: https://www.sciencedirect.com/science/article/abs/pii/S0883292714002601.
|
| 307. |
Flem B, Reimann C, Birke M, Banks D, Filzmoser P. Frengstad B. Inorganic chemical quality of European tap-water: 2. Geographical distribution. Appl Geochem. 2015;59:211-224. Available from: https://www.sciencedirect.com/science/article/abs/pii/S0883292715000232.
|
| 308. |
Pantić TP, Birke M, Petrović B, Nikolov J, Dragišić V, Živanović V. Hydrogeochemistry of thermal groundwaters in the Serbian crystalline core region. J Geochem Explor. 2015;159:101-114. Available from: https://www.sciencedirect.com/science/article/abs/pii/S0375674215300510.
|
| 309. |
Khan MR, Wabaidur SM, Alothman ZA, Busquets R, Naushad M. Method for the fast determination of bromate, nitrate and nitrite by ultra performance liquid chromatography – mass spectrometry and their monitoring in Saudi Arabian drinking water with chemometric data treatment. Talanta 2016;152:513-520. Available from: https://www.sciencedirect.com/science/article/pii/S0039914016301035.
|
| 310. |
Bodor K, Bodor Z, Szép A, Szép R. Classification and hierarchical cluster analysis of principal Romanian bottled mineral waters. J Food Compos Anal. 2021;100:103903. Available from: https://www.sciencedirect.com/science/article/pii/S088915752100103.
|
| 311. |
Latorre MJ, Garcia-Jares C, Medina B, Herrero C. Pattern recognition analysis applied to classification of wines from Galicia (Northwestern Spain) with certified brand of origin. J Agric Food Chem. 1994;42(7):1451-1455. Available from: https://pubs.acs.org/doi/abs/10.1021/jf00043a012.
|
| 312. |
Barbaste M, Medina B, Sarabia LA, Pérez-Trujillo JP. Analysis and comparison of SIMCA models for denominations of origin of wines from de Canary Islands (Spain) builds by means of their trace and ultratrace metals content. Anal Chim Acta 2002;472(1-2):161-174. Available from: https://www.sciencedirect.com/science/article/pii/S0003267002009790.
|
| 313. |
Pérez Trujillo JP, Conde JE, Pont MLP, Câmara J, Marques JC. Content in metallic ions of wines from the Madeira and Azores archipelagos. Food Chem. 2011;124(2):533-537. Available from: https://www.sciencedirect.com/science/article/pii/S0308814610007752.
|
| 314. |
Marengo E, Aceto M. Statistical investigation of the differences in the distribution of metals in Nebbiolo-based wines. Food Chem. 2003;81(4):621-630. Available from: https://www.sciencedirect.com/science/article/pii/S0308814602005642.
|
| 315. |
Coetzee PP, Steffens FE, Eiselen RJ, Augustyn OP, Balcaen L, Vanhaecke F. Multi-element analysis of South African wines by ICP-MS and their classification according to geographical origin. J Agric Food Chem. 2005;53(13):5060-5066. Available from: https://pubs.acs.org/doi/10.1021/jf048268n.
|
| 316. |
Gonzálvez A, Llorens A, Cervera ML, Armenta S, de la Guardia M. Elemental fingerprint of wines from the protected designation of origin Valencia. Food Chem. 2009;112(1):26-34. Available from: https://www.sciencedirect.com/science/article/pii/S0308814608005876.
|
| 317. |
Rodríguez GG, Hernandez-Moreno D, Soler F, Pérez-López M. Characterization of “Ribera del Guadiana” and “Méntrida” Spanish red wines by chemometric techniques according to their mineral content. J Food Nutr Res. 2011;50(1):41-49. Available from: https://www.eweb.unex.es/eweb/toxicologia/Publis%20pdf%20Marcos/JFNR-2011-1-p041-049-garcia-rodriguez.pdf.
|
| 318. |
Aceto M, Robotti E, Oddone M, Baldizzone M, Bonifacino G, Bezzo G, Di Stefano R, Gosetti F, Mazzucco E, Manfredi M, Marengo E. A traceability study on the Moscato wine chain. Food Chem. 2013;138(2-3):1914-1922. Available from: https://www.sciencedirect.com/science/article/pii/S0308814612017463.
|
| 319. |
Durante C, Baschieri C, Bertacchini L, Cocchi M, Sighinolfi S. Silvestri M, Marchetti A. Geographical traceability based on 87Sr/86Sr indicator: A first approach for PDO Lambrusco wines from Modena. Food Chem. 2013;141(3):2779-2787. Available from: https://www.sciencedirect.com/science/article/pii/S0308814613007103.
|
| 320. |
Catarino S, Madeira M, Monteiro F, Caldeira I, de Sousa RB, Curvelo-Garcia A. Mineral Composition through soil-wine system of Portuguese vineyards and its potential for wine traceability. Beverages 2018;4(4):85. Available from: https://www.mdpi.com/2306-5710/4/4/85.
|
| 321. |
Pořízka J, Diviš P, Dvořák M. Elemental analysis as a tool for classification of Czech white wines with respect to grapevine varieties. J Elem. 2018;23(2):709-727. Available from: http://jsite.uwm.edu.pl/articles/view/1379/.
|
| 322. |
Cruz TLE, Esperanza MG, Wrobel K, Barrientos EY, Aguilar FJA, Wrobel K. Determination of major and minor elements in Mexican red wines by microwave-induced plasma optical emission spectrometry, evaluating different calibration methods and exploring potential of the obtained data in the assessment of wine provenance. Spectrochim Acta Part B 2020;164:105754. Available from: https://www.sciencedirect.com/science/article/pii/S0584854719305154.
|
| 323. |
Dembroszky XO, May Z, Hartel T, Zsigmond A-R. Elemental profile of non-commercial wines in changing traditional rural regions from eastern Europe. Environ Engin Manag J. 2020;19(4):625-634. Available from: http://eemj.eu/index.php/EEMJ/article/view/4084.
|
| 324. |
Shimizu H, Akamatsu F, Kamada A, Koyama K, Iwashita K, Goto-Yamamoto N. Variation in the mineral composition of wine produced using different winemaking techniques. J Biosci Bioengin. 2020;130(2):166-172. Available from: https://www.sciencedirect.com/science/article/pii/S1389172320301924.
|
| 325. |
Grembecka M, Kaliś A, Szefer P. What do metals tell us about wine? 3 International IUPAC Symposium on Trace Elements in Food, Rome, Italy, 1-3 April 2009; abstract book, p. 130.
|
| 326. |
Bellido-Milla D, Moreno-Perez JM, Hernández-Artiga MP. Differentiation and classification of beers with flame atomic spectrometry and molecular absorption spectrometry and sample preparation assisted by microwaves. Spectrochim Acta Part B: Atomic Spectroscopy 2000;55(7):855-864. Available from: https://www.sciencedirect.com/science/article/pii/S0584854700001646.
|
| 327. |
Alcázar A, Pablos F, Martín MJ, González AG. Multivariate characterisation of beers according to their mineral content. Talanta 2002;57(1):45-52. Available from: https://www.sciencedirect.com/science/article/pii/S0039914001006701.
|
| 328. |
Wyrzykowska B, Szymczyk K, Ichichashi H, Falandysz J, Skwarzec B, Yamasaki S. Application of ICP sector field MS and principal component analysis for studying interdependences among 23 trace elements in Polish beers. J Agric Food Chem. 2001;49(1):3425-3431. Available from: https://pubs.acs.org/doi/10.1021/jf010184g.
|
| 329. |
Mahmood N, Petraco N, He Y. Elemental fingerprint profile of beer samples constructed using 14 elements determined by inductively coupled plasma–mass spectrometry (ICP-MS): multivariation analysis and potential application to forensic sample comparison. Anal Bioanal Chem. 2012;402(2):861–869. Available from: https://link.springer.com/article/10.1007%2Fs00216-011-5452-y.
|
| 330. |
Carter JF, Yates HSA, Tinggi U. A global survey of the stable isotope and chemical compositions of bottled and canned beers as a guide to authenticity. Sci Justice 2015;55(1):18-26. Available from: https://www.sciencedirect.com/science/article/pii/S1355030614000574?via%3Dihub.
|
| 331. |
Voica C, Magdas D-A, Feher I. Metal content and stable isotope determination in some commercial beers from Romanian markets. J Chem. 2015;192032:1-10. Available from: https://www.hindawi.com/journals/jchem/2015/192032/.
|
| 332. |
Rodrigo S, Young SD, Talaverano MI, Broadley MR. The influence of style and origin on mineral composition of beers retailing in the UK. Eur Food Res Techn. 2017;243(6):931-939. Available from: https://link.springer.com/article/10.1007/s00217-016-2805-y.
|
| 333. |
Styburski D, Janda K, Baranowska Bosiacka I, Łukomska A, Dec K, Goschorska M, Michalkiewicz B, Ziętek P, Gutowska I. Beer as a potential source of macroelements in a diet: the analysis of calcium, chlorine, potassium, and phosphorus content in a popular low-alcoholic drink. Eur Food Res Techn. 2018;244(10):1853-1860. Available from: https://link.springer.com/article/10.1007/s00217-018-3098-0.
|
| 334. |
Redan BW, Jablonski JE, Halverson C, Jaganathan J, Abdul Mabud M, Jackson LS. Factors affecting transfer of the heavy metals arsenic, lead, and cadmium from diatomaceous-earth filter aids to alcoholic beverages during laboratory-scale filtration. J Agric Food Chem. 2019;67(9):2670-2678. Available from: https://pubs.acs.org/doi/10.1021/acs.jafc.8b06062.
|
| 335. |
García-Ruiz S, Moldovan M, Fortunato G, Wunderli S, Ignacio J, Alonso G. Evaluation of strontium isotope abundance ratios in combination with multi-elemental analysis as a possible tool to study the geographical origin of ciders. Anal Chim Acta 2007;590(1):55-66. Available from: https://www.sciencedirect.com/science/article/pii/S0003267007005028?via%3Dihub.
|
| 336. |
Cristea G, Voica C, Feher I, Radu S, Magdas DA. Isotopic and elemental characterization of cider commercialized on Romanian market. Anal Lett. 2019;52(1):139-149. Available from: https://www.tandfonline.com/doi/full/10.1080/00032719.2018.1434189.
|
| 337. |
Adam T, Duthie E, Feldmann J. Investigations into the use of copper and other metals as indicators for the authenticity of Scotch whiskies. J Inst Brew. 2002;108(4):459-464. Available from: https://onlinelibrary.wiley.com/doi/abs/10.1002/j.2050-0416.2002.tb00576.x.
|
| 338. |
Cameán AM, Moreno I, López-Artı́guez M, Repetto M, González AG. Differentiation of Spanish brandies according to their metal content. Talanta 2001;54(1):53-59. Available from: https://www.sciencedirect.com/science/article/pii/S0039914000006238.
|
| 339. |
Shand CA, Wendler R, Dawson L, Yates K, Stephenson H. Multivariate analysis of Scotch whisky by total reflection x-ray fluorescence and chemometric methods: A potential tool in the identification of counterfeits. Anal Chim Acta 2017;976:14-24. Available from: https://www.sciencedirect.com/science/article/pii/S0003267017305317?via%3Dihub.
|
| 340. |
Rodríguez RI, Delgado MF, García JB, Peña Crecente RM, Martín SG, Latorre CH. Comparison of several chemometric techniques for the classification of orujo distillate alcoholic samples from Galicia (northwest Spain) according to their certified brand of origin. Anal Bioanal Chem. 2010;397(6):2603-2614. Available from: https://link.springer.com/article/10.1007%2Fs00216-010-3822-5.
|
| 341. |
Szefer P, Gełdon J, Ali AA, Bawazir A, Sad M. Distribution and association of trace metals in soft tissue and byssus of Perna perna from the Gulf of Aden, Yemen. Environ. Intern. 1997;23(1):53-61. Available from: https://www.sciencedirect.com/science/article/pii/S0160412096000773.
|
| 342. |
Szefer P, Ali AA, Ba-Haroon AA, Rajeh AA, Geldon J, Nabrzyski M. Distribution and relationships of selected trace metals in some molluscs and associated sediments from the Gulf of Aden, Yemen. Environ. Pollut. 1999;106(3):299-314. Available from: https://www.sciencedirect.com/science/article/pii/S0269749199001086.
|
