

Measurement of agouti-related peptide and myeloperoxidase levels and assessment of their potential role in the metabolic pathways of obese individuals with type 2 diabetes


Abstract
Background: Agouti-related peptide (AgRP) and myeloperoxidase (MPO) are key markers associated with metabolic and inflammatory dysfunctions linked to type 2 diabetes (T2DM) and obesity through appetite-regulating mechanisms and immune activity.
Material and methods: Total of 150 participants (30-55 years old) were separated into 3 groups: control group, the obesity group, and the T2DM with obesity group. Fasting blood samples were collected. Biochemical tests (e.g. fasting glycemia and lipid profile), were determined using colorimetric methods, while insulin, AgRP, and MPO were measured using ELISA. Statistical analyses (e.g. one-way ANOVA, multiple linear regression, ROC analysis) were conducted.
Results: AgRP was significantly higher in the obesity and T2DM with obesity groups. Conversely, MPO levels significantly decreased in these groups (p < 0.0001) compared to the control group. The ROC curve showed good discriminatory performance between patient and control groups.
Conclusions: Increased AgRP levels might reflect alterations of appetite and energy balance, while decreased MPO levels may indicate a complex inflammatory response that could involve enzyme retention in certain tissues. This study confirmed the importance of AgRP and MPO as potential supplementary indicators of metabolic disorders. There is a need for more studies to elucidate the mechanisms underlying the decrease in MPO in these patients.
Citation
Lateef N D, Khaleel F M. Measurement of agouti-related peptide and myeloperoxidase levels and assessment of their potential role in the metabolic pathways of obese individuals with type 2 diabetes. Eur J Transl Clin Med.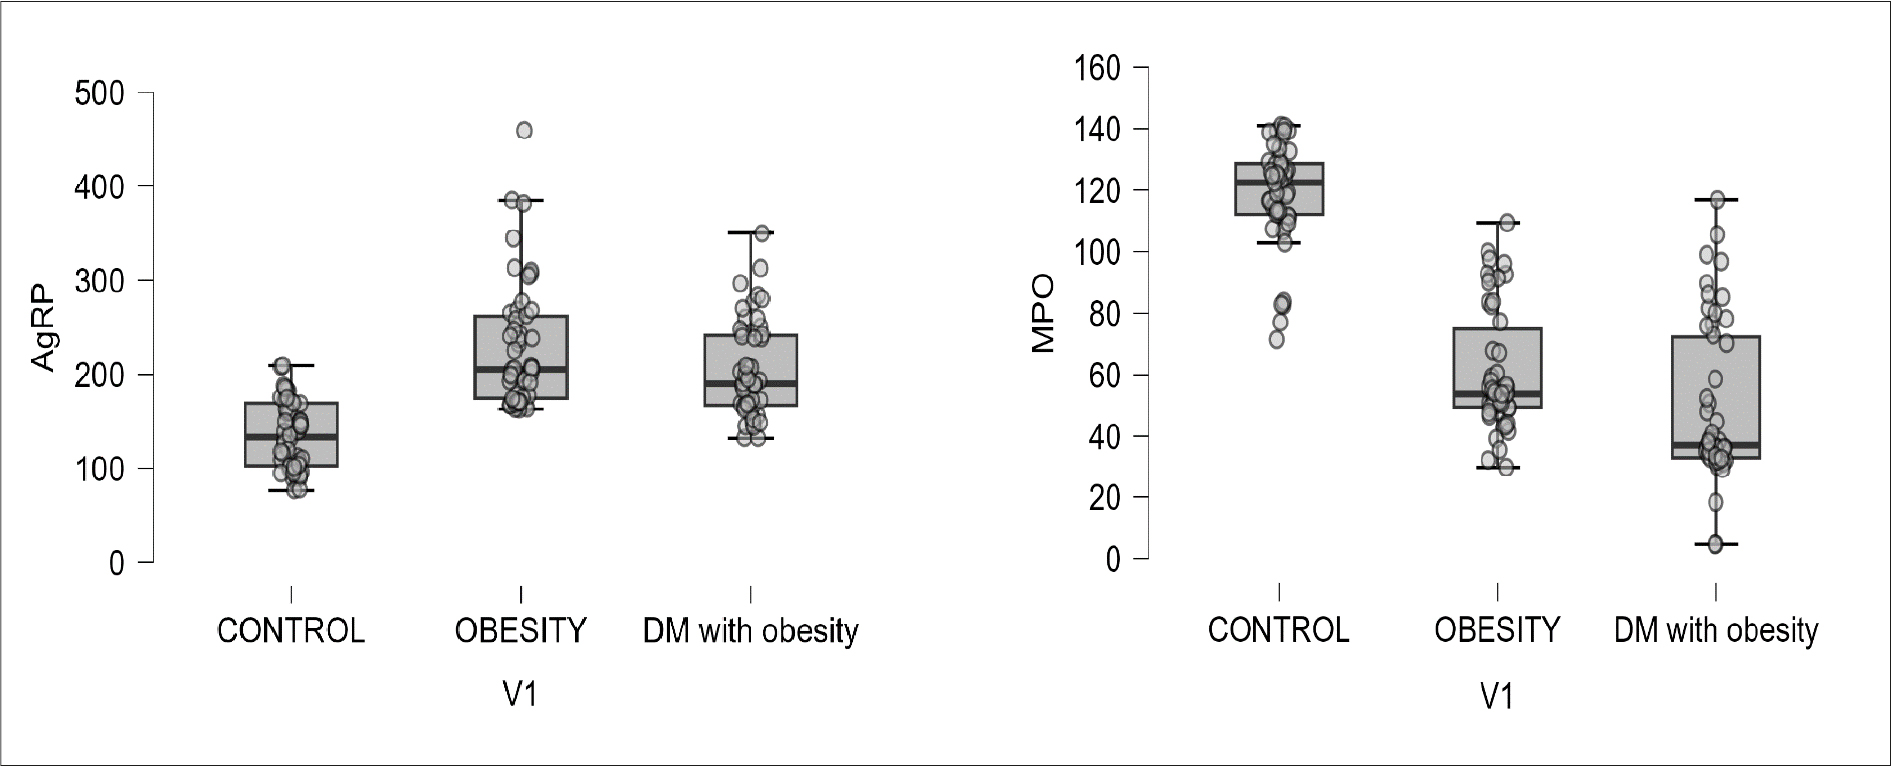


Introduction
Obesity was originally characterized by excessive adipose tissue accumulation. The understanding of obesity has evolved into a complex illness with significant effects on physiological and metabolic processes, and it is no longer considered strictly a result of lifestyle decisions [1-2]. In type 2 diabetes mellitus (T2DM), the body becomes insulin resistant (IR), which forces the pancreatic beta cells to secrete higher amounts of insulin to produce a glucose-lowering effect. Over time, the pancr eatic beta cells might become unable to produce enough insulin to compensate for IR, which leads to relative insulin deficiency and elevated blood glucose levels [3]. In obese individuals, IR is more common due to shared pathophysiological pathways between obesity and T2DM. Furthermore, changes in adipose tissue biology that link obesity to IR and impaired beta-cell function lead to increased incidence of T2DM, in line with increasing abdominal fat distribution and body mass index (BMI) [4-5]. Despite its common use as a criterion for classifying obesity, the BMI does not accurately reflect the distribution of body fat or the metabolic dysfunction associated with obesity. That is why the European Association for the Study of Obesity (EASO) has indicated that functional impairment associated with fat should be the basis for defining obesity [6].
Agouti-related peptide (AgRP) is a type of neuropeptide produced by the AgRP/NPY neurons (neuropeptide Y) in the ventral part of the arcuate nucleus of the hypothalamus [7-8]. In humans its transcription is composed of 132 amino acids [9]. AgRP acts as an internal competitor to the MC3R and MC4R of melanocortin receptors and is essential for the control of energy balance [10]. If AgRP/NPY neurons’ activity increases, then food consumption will increase and less energy will be expended, leading to weight gain. These neurons are a component of a complex neural network that reacts to several energy-related cues, including hormones that signal hunger (ghrelin) or fullness (insulin and leptin). AgRP/NPY neurons are activated during periods of low energy (e.g. fasting), which increases hunger and encourages eating-seeking conduct [11-12]. AgRP neuronal activity modulates feeding and glucose homeostasis, with disrupted insulin signaling contributing to insulin resistance and the etiology of T2DM [13-14].
Myeloperoxidase (MPO, EC 1.11.2.2), is a type of heme peroxidase, generally found in the neutrophils and, with less content, in monocytes. MPO has extensive bactericidal activity by catalyzing the Cl reaction with H2O2 to produce the potent oxidant hypochlorous acid (HOCl). But excessive MPO-derived oxidant generation has harmful effects, particularly in conditions where inflammation is either acute or chronic [15]. Over the past years, there has been a significant shift away from the prevalent and oversimplified understanding of MPO as a cytotoxic agent. It is now clear that MPO has functions that extend beyond its antibacterial properties and contribute to the host sustaining tissue damage. MPO has been shown to directly influence the function of inflammatory cells in addition to neutrophils, endothelium, dendritic cells, macrophages, and epithelial cells, as well as to influence immunity [16-17]. Obesity associated with diabetes increases oxidative stress, which leads to increased MPO activity and exacerbates inflammation, lipid abnormalities, vascular damage, and insulin resistance compared to obese non-diabetic individuals [18]. The relationship between AgRP and MPO and T2DM linked to insulin resistance and obesity remains unclear despite a growing number of studies on the subject. The purpose of this study was to investigate the role of AgRP and MPO in metabolic disorders and oxidative stress in people who are obese with T2DM and without.
Materials and methods
Study design
This research was conducted from January to March 2026 at the Al-Yarmouk Teaching Hospital (Baghdad, Iraq) in collaboration with the College of Science for Women at the University of Baghdad. A total of 150 adults, aged 30-55 years, were enrolled and equally divided into 3 groups according to their clinical status. Group 1 (control group) consisted of 50 individuals with no history of DM, obesity, or other chronic diseases (BMI ≤ 25 kg/m²). Group 2 (obesity only) included 50 people diagnosed with obesity only but without medical history of DM or chronic disease (BMI ≥ 30 kg/m²). Group 3 (DM with obesity) included 50 individuals diagnosed with both obesity and T2DM (BMI ≥ 30 kg/m²). The sample size was determined based on previous studies that investigated the biochemistry that links obesity and T2DM. Exclusion criteria included pregnancy, cardiovascular diseases, thyroid diseases, renal disease, autoimmune disorders, malignancies, insulin injections and use of medications that are known to impair neutrophil activity. The participants provided informed consent and met the diagnostic criteria for obesity and diabetes as applicable. This study was approved by the local Scientific Research Ethics Committee (Approval No. CSW-REC 1018).
Anthropometric measurements
All participants completed a questionnaire and recorded a set of characteristics such as gender, age, and medical history. Weight, height, and waist circumference were also measured in the normal standing position. BMI was computed by dividing weight in kilograms by squared height in meters(kg/m²). The waist-to-hip ratio (WHR) was computed by dividing the waist circumference in cm by the hip circumference in cm. The waist-to-height ratio (WHtR) was calculated dividing the waist in cm by the height in cm.
Laboratory measurements Venous blood fasting samples were collected after 8-12 hours of fasting. Biochemical analyses included fasting blood glucose and lipid profile (LDL, HDL, triglycerides, and total cholesterol). Fasting serum insulin, AgRP) and MPO were measured using a human ELISA kit (ELK Biotechnology, Sugar Land, TX, USA) according to the instructions from the manufacturer. The assay sensitivity for AgRP is 3.1 pg/mL, and the detection range is 7.82-500 pg/mL. For MPO, the assay sensitivity was 0.65 ng/mL, and the detection range is 2.34-150 ng/mL; the absorbance was measured using a HumaReader HS microplate reader (HUMAN Gesellschaft für Biochemica und Diagnostica mbH, Wiesbaden, Germany). Insulin resistance was computed using the Homeostatic Model Assessment of Insulin Resistance (HOMA-IR) model, which is [Insulin (µU/mL) × Glucose (mg/dL)]/405 [19].
Statistical analysis
The Social Sciences Statistical Package (v. 26, SPSS Inc., Chicago, USA) and JASP (v. 0.19.1, JASP Team) were used for the statistical analysis [20]. The data is presented as mean ± SD. Analyses included one-way ANOVA to compare groups, Pearson’s correlation analysis, multiple linear regression (including VIF for multicollinearity) and ROC curve analysis. A p-value ≤ 0.05 was deemed significant statistically.
Results
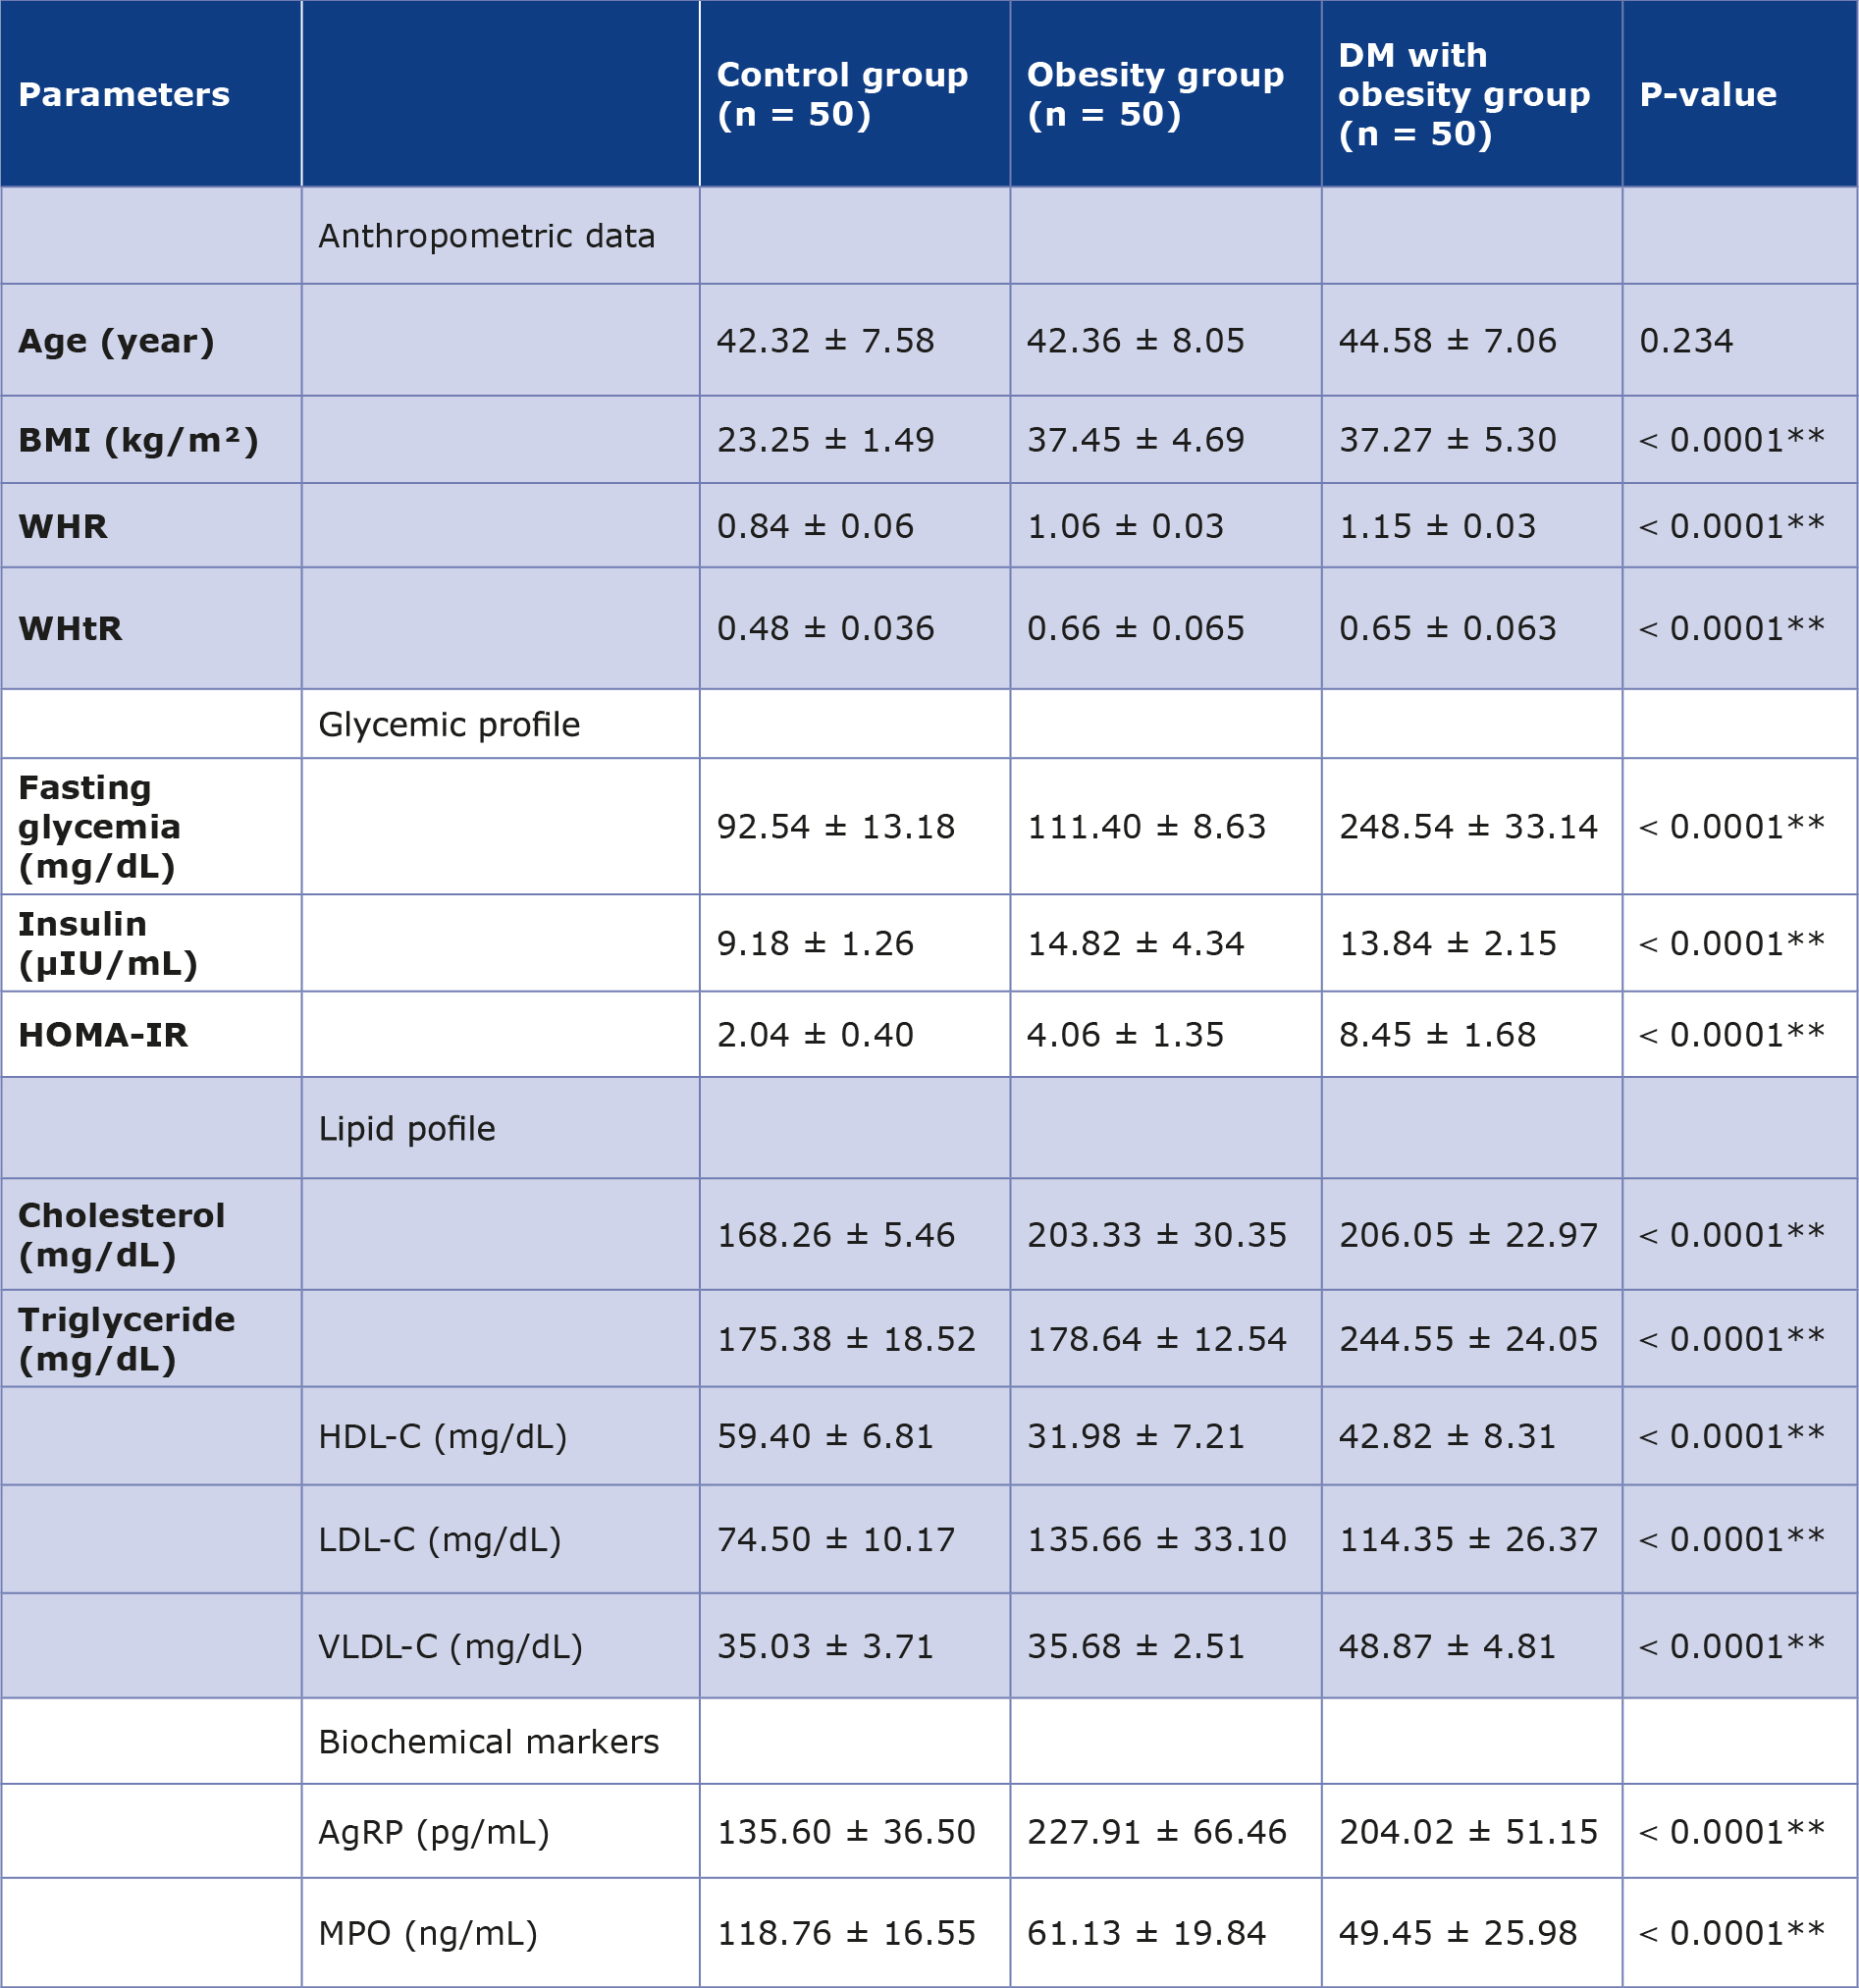
The duration of diabetes in the DM with obesity group ranged from < 3 years to 10 years. The mean ± SD values for BMI, WHR, and WHtR in the obesity group and the DM with obesity group were significantly higher compared with the control group (Table 1). Both fasting glycemia and HOMA-IR showed a higher value in the DM with obesity group relative to the control group. All lipid profile indices were elevated in the obesity and DM with obesity groups, except for HDL-C which decreased in both these groups compared to the control group. VLDL-C levels were noticeably higher in the DM with obesity group compared with the other groups.
Table 1. Mean ± SD of anthropometric data, biochemical parameters, and main metabolic parameters among three groups
** ANOVA test significant difference between means at level p < 0.01
The AgRP levels in the obesity group and the DM with obesity group were significantly elevated (mean value ± SD: 227.91 ± 66.46 pg/mL and 204.02 ± 51.15 pg/mL, respectively) compared to the control group. In contrast, MPO was decreased in the patient groups compared with the control group (mean value ± SD: 118.76 ± 16.55 ng/mL).
The correlation analysis showed a positive correlation between WHtR and AgRP (r = 0.438, p < 0.001), while MPO showed a negative correlation with WHtR (r = -0.628, p < 0.001) (Table 2). Additionally, AgRP and MPO showed a moderate negative correlation with each other (r = -0.345, p < 0.001).
Table 2. Correlation analysis between WHtR with AgRP and MPO levels
At p < 0.001, it is considered statistically significant.
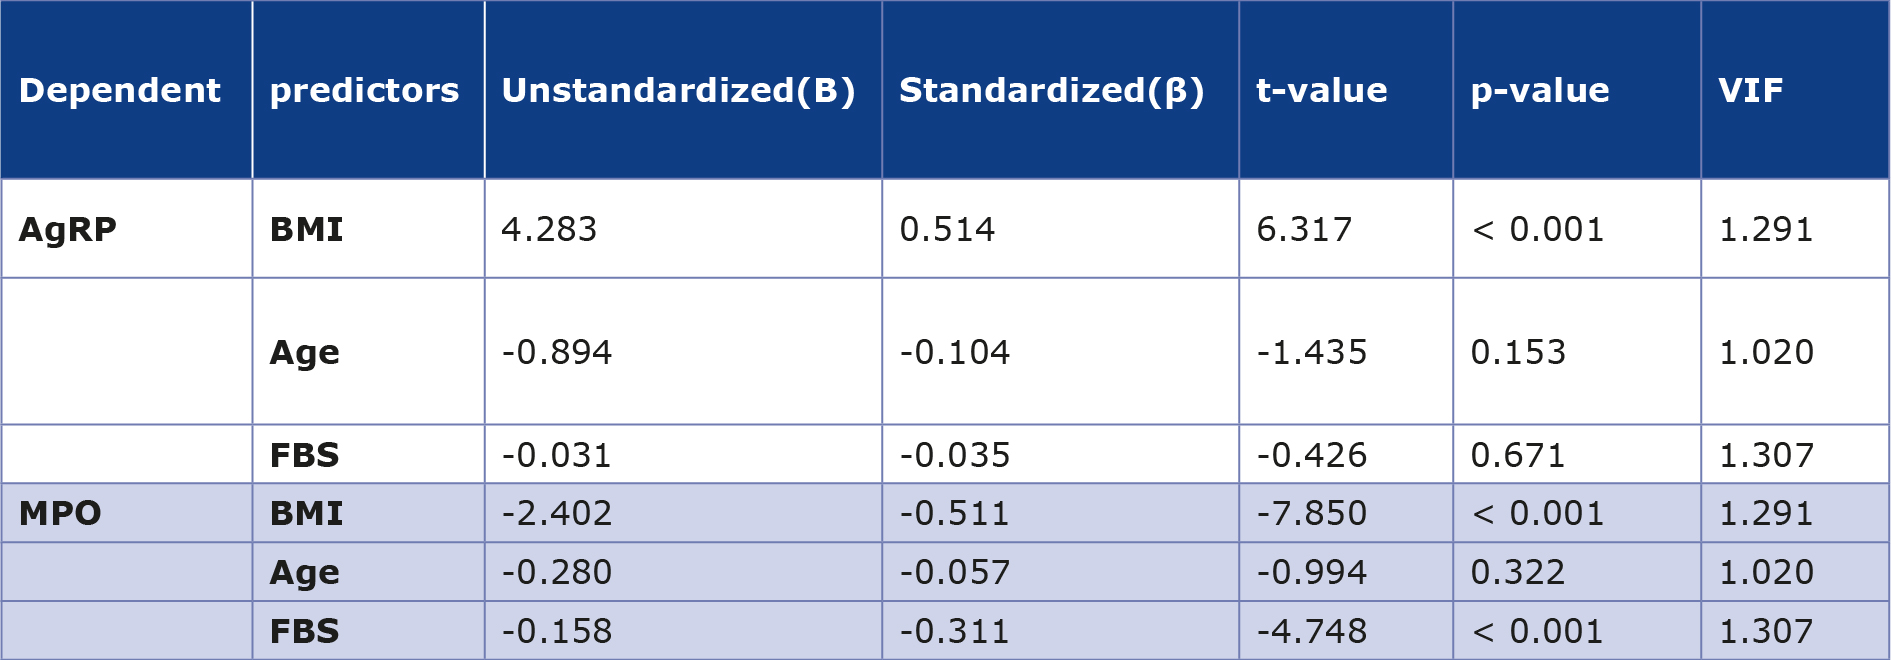
Multiple linear regression analysis revealed that AgRP was positively associated with BMI (β = 0.514, p < 0.001) and shows no significant correlation with age or fasting glycemia, while MPO was negatively correlated with both BMI (β = -0.511, p < 0.001) and fasting glycemia (β = -0.311, p < 0.001) (Table 3).
Table 3. Multiple linear regression analysis of AgRP and MPO levels
The box plot analysis showed that AgRP levels were higher in both the obesity and DM with obesity groups. In contrast, MPO levels were lower in these groups compared to the control group, as shown in Figure 1.
Figure 1. Box plot showing the distribution of serum AgRP and MPO levels among the 3 study groups. The horizontal line represents the median, the box represents the interquartile range, and the circles represent the individual observations.
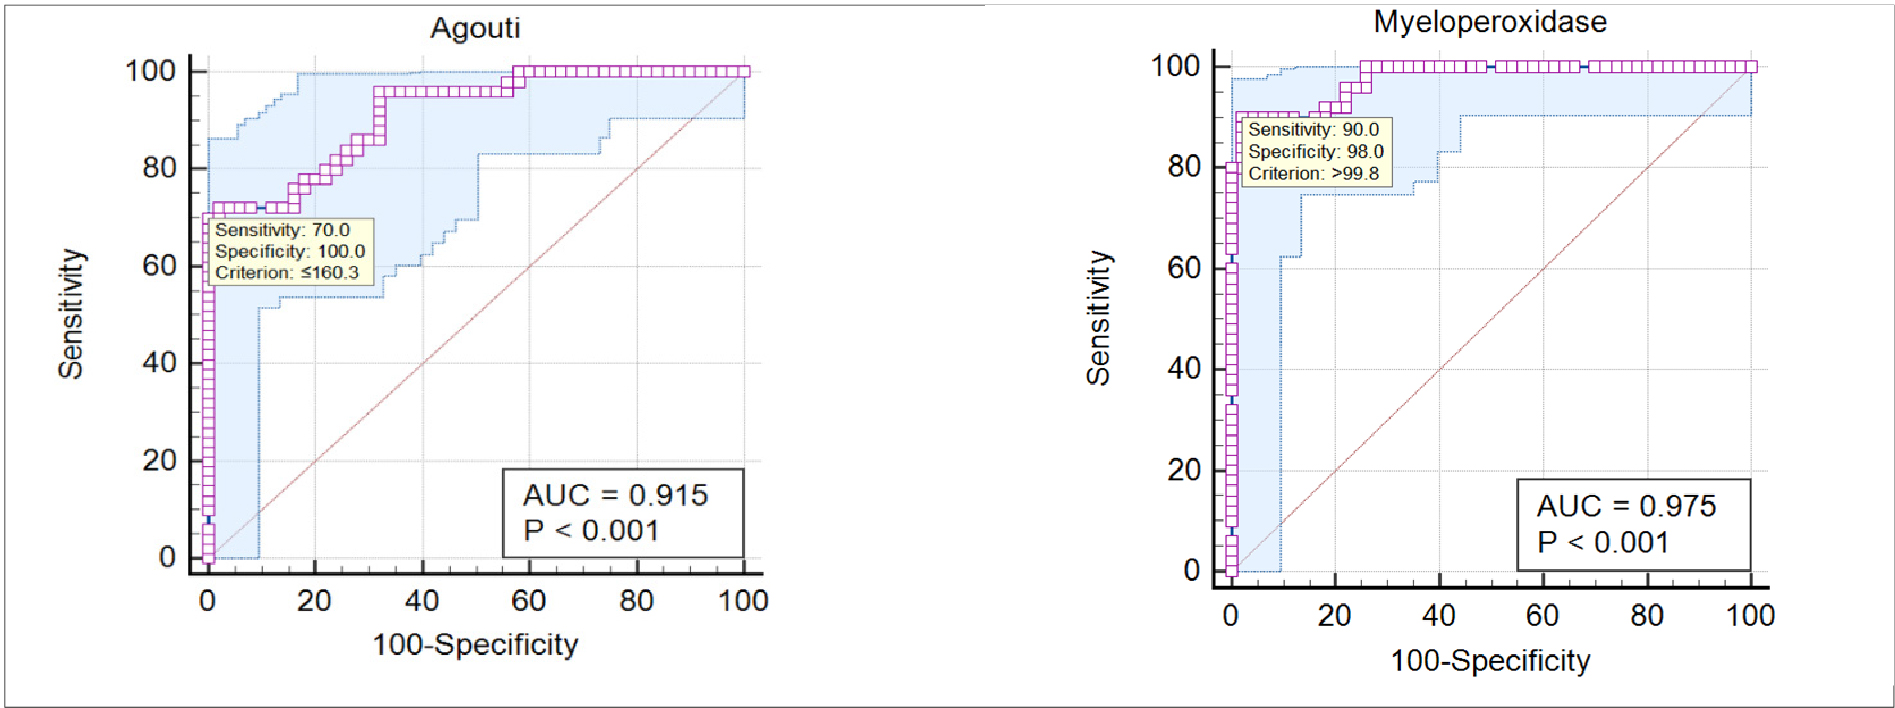
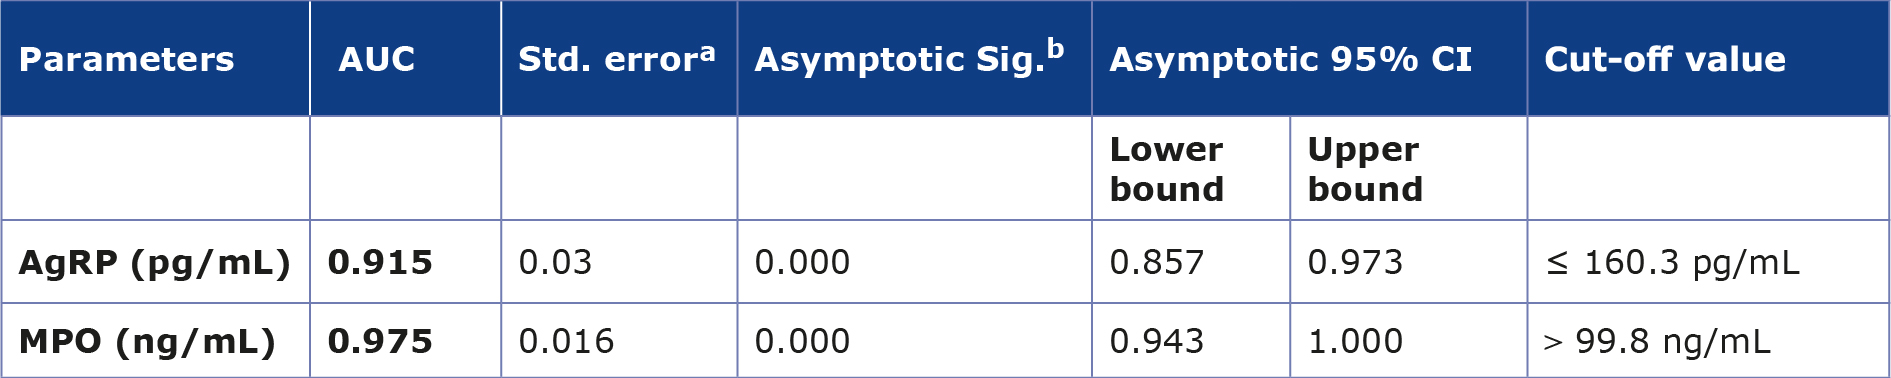
Table 4 shows the results of the ROC analysis between the control and obesity groups. The area under the AUC of the ROC curve for AgRP and MPO proved to be indicating good discriminatory performance, having values of 0.915 and 0.975, respectively, as shown in Figure 2.
Table 4. AUC value of the AgRP and MPO between control and obesity groups
Figure 2. ROC curve analysis of AgRP and MPO between control and obesity groups
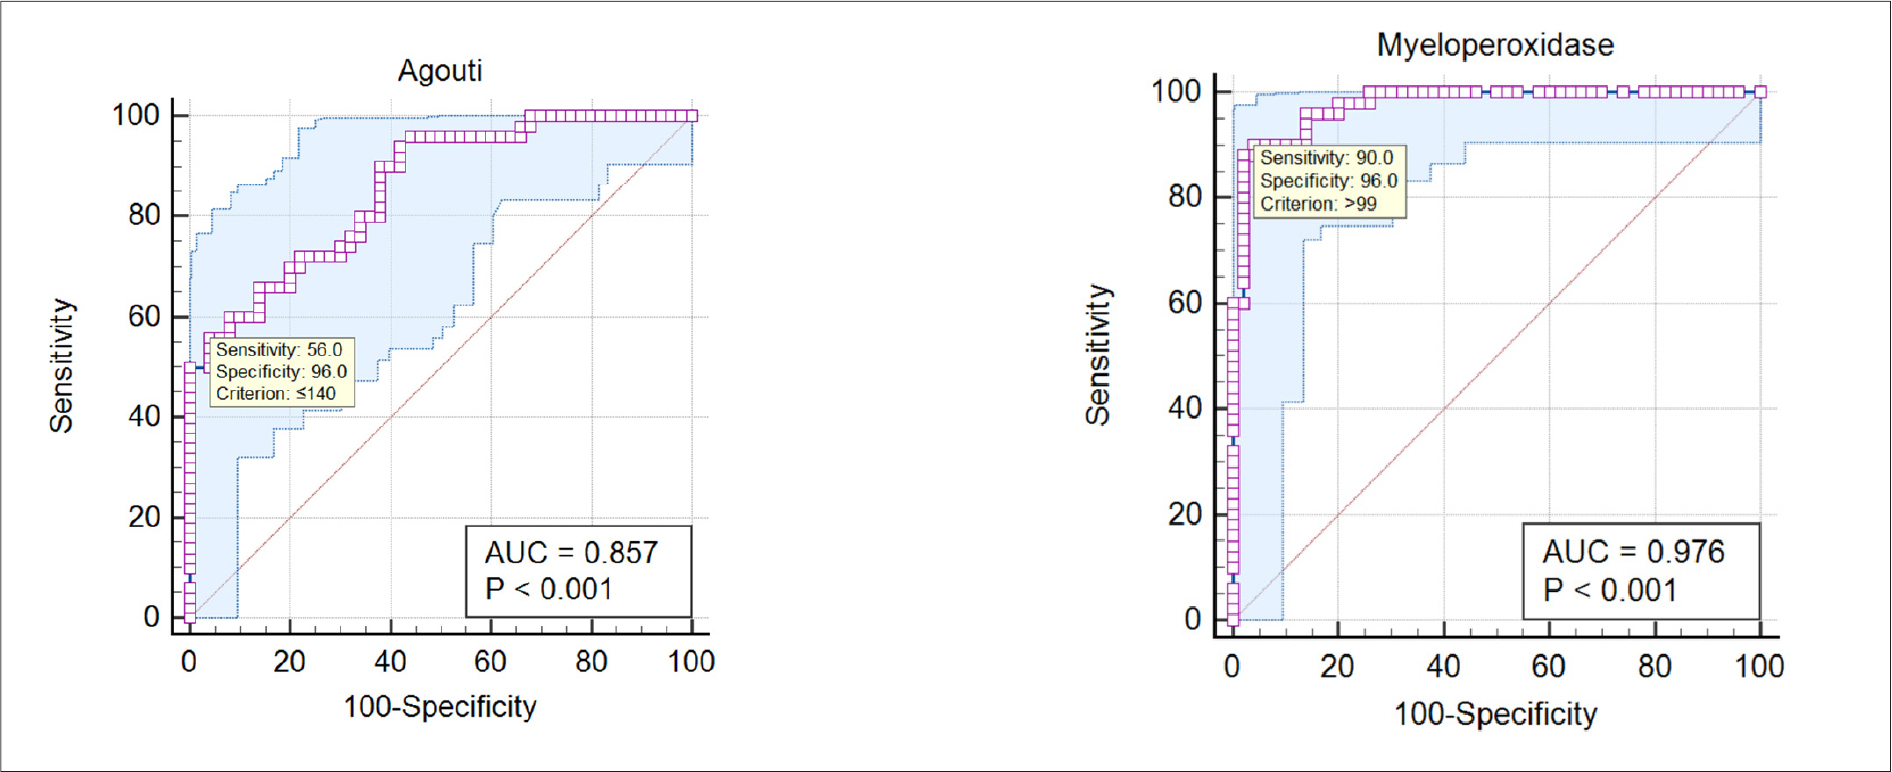
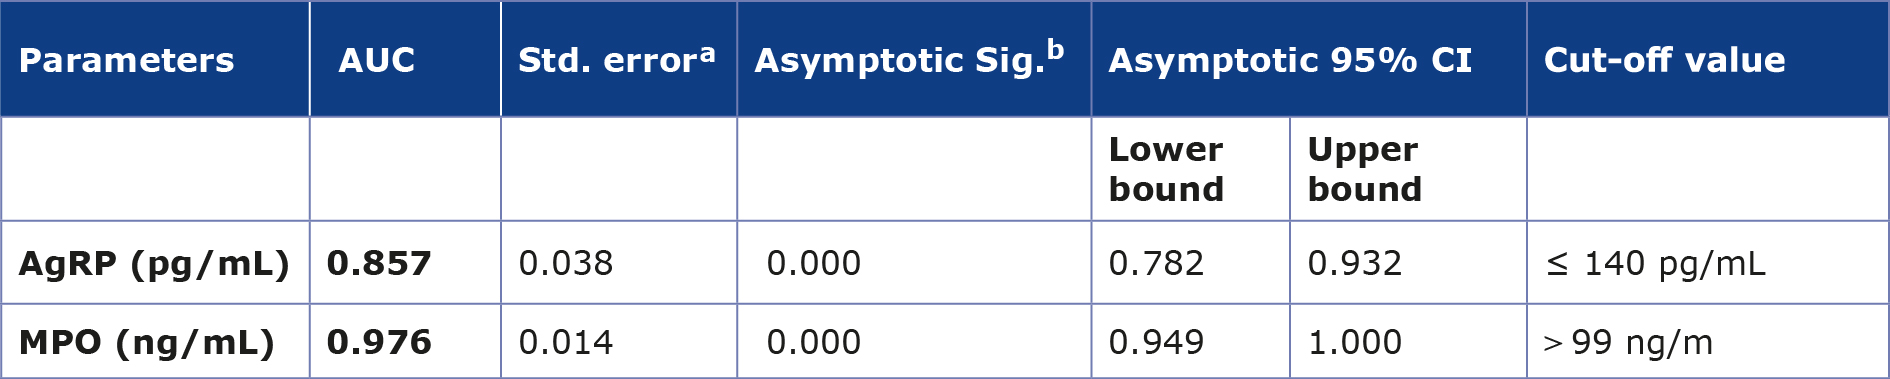
Table 5 presents the ROC analysis, which showed a good discriminatory performance for AgRP and MPO between the control and the DM with obesity groups, with AUC values of 0.857 and 0.976, respectively, as shown in Figure 3.
Table 5. AUC value of the AgRP and MPO between control and DM with obesity groups
Figure 3. ROC curve analysis of AgRP and MPO between control and DM with obesity groups
Discussion
BMI is used to assess obesity, but it doesn’t account for fat distribution differences [21]. Recent frameworks by the Lancet Commission and EASO have highlighted the limitations of BMI in diagnosing obesity, however it remains the routinely used criterion for obesity classification in Iraq according to the WHO classification [6, 22-23]. Therefore, BMI was used as the primary criterion for obesity classification among the participants in the present study [23]. As excess weight advances, many individuals develop a characteristic pattern of fat accumulation in the abdominal region, leading to a larger waist circumference and a higher WHR and WHtR. A high WHR is a predictive risk factor that plays a role in several diseases, e.g. T2DM and heart disease [24]. In addition, WHtR may provide additional information for the assessment and classification of obesity [25]. Obesity particularly central obesity, is a metabolic disorder that impairs insulin responsiveness and causes persistent low-grade inflammation. Elevated levels of inflammatory cytokines trigger multiple intracellular signaling pathways, promoting lipid accumulation within adipocytes and, thereby, playing an important part in the progress of IR and T2DM [26-27].
Our regression model verified the independent impact of obesity on circulating AgRP, implying that these changes are mostly caused by obesity, independent of age or blood sugar levels. Similarly to Su et al., AgRP is an efficient peptide that enhances appetite; the hormone ghrelin activates its effect on appetite; therefore, increased food intake is associated with increased AgRP expression [28]. AgRP neurons release neurotransmitters, such as NPY, to increase hunger, while the pro-opiomelanocortin (POMC) fibers release α-MSH to reduce hunger and increase satiety. The competitive interaction between these neurotransmitters influences the degree of satiety felt after a meal [29]. During fasting in the arcuate nucleus, decreased leptin plays a role in increasing food consumption and reducing energy spending through POMC inhibition and AgRP/NPY cell activation [30]. Overeating and poor glucose regulation are promoted by obesity’s central oxidative stress in the hypothalamus, where increased reactive oxygen species interfere with the function of energy-regulating neural circuits, including AgRP cells [31]. A study conducted by Zhang et al. indicated that AgRP is intimately linked to oxidative stress and metabolic degradation. Increased oxidative load inside AgRP cells themselves, resulting from disturbed mineral balance and metabolism, exacerbates obesity, insulin resistance, and impaired glucose balance [32]. The neural circuits responsible for regulating appetite and energy may be disrupted as a result of hypothalamic dysfunction caused by oxidative imbalance and metabolic stress. Furthermore, circulating AgRP levels may not accurately reflect central hypothalamic activity, therefore the peripheral measurements should be interpreted with caution.
Although inconsistent with several previous studies, the low levels of MPO in our study among participants with T2DM and obesity, may be explained by multiple mechanisms. Labato et al. indicated that neutrophil secretion may be impaired or affected by chronic metabolic dysregulation in obese individuals with T2DM, leading to a disruption in the granule release process and consequently reducing the release of MPO into the bloodstream [33]. Similarly, evidence suggests that circulating MPO levels in chronic inflammation are subject to a complex regulatory mechanism. This complexity indicates that MPO levels may not always follow a linear pattern because their release into the circulation may not strictly correspond to their total protein content or enzymatic activity, or their functions may be actively suppressed [34]. In addition, MPO is considered a bridge link between oxidative stress, inflammation and systemic diseases. Studies have reported changes in oxidative stress in patients with T2DM, which may contribute to metabolic dysfunction or disorder [35-36]. Due to MPO’s high reactivity with various substrates such as lipids and proteins, the enzyme may be consumed in multiple pathways in metabolic states characterized by high oxidative burden, such as obesity and T2DM [15, 37]. Therefore, decreased circulation of MPO should be interpreted cautiously and does not imply the absence of inflammatory activity. Furthermore, intracellular enzyme activity and tissue retention in chronic metabolic conditions require more studies.
The ROC analysis in our study for both AgRP and MPO showed a good AUC value. This may indicate that AgRP and MPO are sensitive to early metabolic and oxidative alterations, which could support their potential use as early biomarkers of metabolic dysregulation. However, further validation studies are still needed to define their precise role.
Study limitations
Despite the importance of its findings, this study has many limitations. Firstly, serum MPO measurements do not necessarily represent its real functional activity within tissues. Additionally, the cross-sectional design of the study may not demonstrate a causal relationship between AgRP and MPO. We measured only peripheral AgRP, which may not fully reflect central neuroendocrine signaling pathways. Another limitation is the exclusion of the BMI 25-30 kg/m² group. In individuals with a BMI between 25 and 30 kg/m², there may be increased cardiometabolic risk and metabolic dysfunction associated with obesity [38]. Our sample size and the fact that the participants were recruited within a single geographical area may restrict the generalizability of our results. In addition, lifestyle factors, dietary habits, physical activity, smoking status, ethnic differences, and the use of oral antidiabetic medications were also not fully evaluated among our study participants, which may have affected some anthropometricindicators and circulating biomarker levels. Furthermore, the lack of HbA1c measurements may restrict the thorough evaluation of long-term glucose control.
Conclusion
AgRP and MPO are associated with metabolic disorders observed in both T2DM and obesity. An increase in AgRP levels may reflect a potential disruption in the neural control of appetite and energy balance, which may contribute to overeating and impaired glucose regulation. In contrast, the observed decrease in MPO may suggest a complex inflammatory response possibly related to enzyme consumption in tissues as a result of chronic oxidative stress. Further studies are needed to test this hypothesis. Although there is no direct link between AgRP and MPO, these biomarkers may be indirectly connected through pathways associated with insulin resistance and the onset of T2DM due to the metabolic dysfunction in obesity. This supports their potential role as complementary markers of metabolic disorders rather than as stand-alone diagnostic tools. Long-term and longitudinal research is required to confirm these biomarkers’ clinical relevance and usefulness.
Acknowledgements
We extend our sincere thanks to everyone who contributed to and supported this study and helped in its successful completion, including the doctors and laboratory staff at the Yarmouk Teaching Hospital.
Conflicts of interest
The authors confirm that no a conflicts of interest were present.
Data availability
The datasets generated or analyzed in this study is not publicly available due to ethical and participant privacy considerations, but it is available upon reasonable request.
References
| 1. |
Bond ST, Calkin AC, Drew BG. Adipose-Derived Extracellular Vesicles: Systemic Messengers and Metabolic Regulators in Health and Disease. Front Physiol [Internet]. 2022;13. Available from: https://www.frontiersin.org/articles/10.3389/fphys.2022.837001/full.
|
| 2. |
Sharma G, Woods CD, Rajkarnikar R, Hathaway HJ, Prossnitz ER. LBODP005 Gper Modulates Multiple Functions In Adipose Tissue To Promote An Anti-obese Phenotype. J Endocr Soc [Internet]. 2022;6(Supplement_1):A3–A3. Available from: https://academic.oup.com/jes/article/6/Supplement_1/A3/6787312.
|
| 3. |
Parcha V, Heindl B, Kalra R, Li P, Gower B, Arora G, et al. Insulin Resistance and Cardiometabolic Risk Profile Among Nondiabetic American Young Adults: Insights From NHANES. J Clin Endocrinol Metab [Internet]. 2022;107(1):e25–37. Available from: https://academic.oup.com/jcem/article/107/1/e25/6362635.
|
| 4. |
Klein S, Gastaldelli A, Yki-Järvinen H, Scherer PE. Why does obesity cause diabetes? Cell Metab [Internet]. 2022;34(1):11–20. Available from: https://linkinghub.elsevier.com/retrieve/pii/S1550413121006318.
|
| 5. |
Kadium TE, Alrubaie A, Ghanim SAM. The Link between Serum Omentin Level and Insulin Resistance Biomarkers, Lipid Profile, and Atherogenic Indices in Iraqi Obese Patients. Baghdad Sci J [Internet]. 2023;20(1):0074. Available from: https://bsj.uobaghdad.edu.iq/home/vol20/iss1/5.
|
| 6. |
Busetto L, Dicker D, Frühbeck G, Halford JCG, Sbraccia P, Yumuk V, et al. A new framework for the diagnosis, staging and management of obesity in adults. Nat Med [Internet]. 2024;30(9):2395–9. Available from: https://www.nature.com/articles/s41591-024-03095-3.
|
| 7. |
Vohra MS, Benchoula K, Serpell CJ, Hwa WE. AgRP/NPY and POMC neurons in the arcuate nucleus and their potential role in treatment of obesity. Eur J Pharmacol [Internet]. 2022;915:174611. Available from: https://linkinghub.elsevier.com/retrieve/pii/S0014299921007676.
|
| 8. |
Katsu Y, Iguchi T, Takei Y, Ando H, Tsutsui K. Agouti-related protein. In: Takei Y, Ando H, Tsutsui K, editors. Handbook of Hormones: Comparative Endocrinology for Basic and Clinical Research. Academic Press; 2015. p. 70–1.
|
| 9. |
Han J, Liang X, Guo Y, Wu X, Li Z, Hong T. Agouti-related protein as the glucose signaling sensor in the central melanocortin circuits in regulating fish food intake. Front Endocrinol (Lausanne) [Internet]. 2022;13. Available from: https://www.frontiersin.org/articles/10.3389/fendo.2022.1010472/full.
|
| 10. |
Takeuchi S. Agouti-related protein. In: Handbook of Hormones [Internet]. Elsevier; 2021. p. 115–6. Available from: https://linkinghub.elsevier.com/retrieve/pii/B9780128206492000309.
|
| 11. |
Atasoy D, Betley JN, Su HH, Sternson SM. Deconstruction of a neural circuit for hunger. Nature [Internet]. 2012;488(7410):172–7. Available from: https://www.nature.com/articles/nature11270.
|
| 12. |
Chen Y, Lin Y-C, Zimmerman CA, Essner RA, Knight ZA. Hunger neurons drive feeding through a sustained, positive reinforcement signal. Elife [Internet]. 2016;5. Available from: https://elifesciences.org/articles/18640.
|
| 13. |
Dodd GT, Kim SJ, Méquinion M, Xirouchaki CE, Brüning JC, Andrews ZB, et al. Insulin signaling in AgRP neurons regulates meal size to limit glucose excursions and insulin resistance. Sci Adv [Internet]. 2021;7(9). Available from: https://www.science.org/doi/10.1126/sciadv.abf4100.
|
| 14. |
Abed BA, Farhan LO, Dawood AS. Relationship between serum Nesfatin-1, Adiponectin, Resistin Concentration, and Obesity with Type 2 Diabetes Mellitus. Baghdad Sci J [Internet]. 2023; Available from: https://bsj.uobaghdad.edu.iq/home/vol21/iss1/22.
|
| 15. |
Lin W, Chen H, Chen X, Guo C. The Roles of Neutrophil-Derived Myeloperoxidase (MPO) in Diseases: The New Progress. Antioxidants [Internet]. 2024;13(1):132. Available from: https://www.mdpi.com/2076-3921/13/1/132.
|
| 16. |
Silvestre-Roig C, Hidalgo A, Soehnlein O. Neutrophil heterogeneity: implications for homeostasis and pathogenesis. Blood [Internet]. 2016;127(18):2173–81. Available from: https://ashpublications.org/blood/article/127/18/2173/35073/Neutrophil-heterogeneity-implications-for.
|
| 17. |
Filep JG, Ariel A. Neutrophil heterogeneity and fate in inflamed tissues: implications for the resolution of inflammation. Am J Physiol Physiol [Internet]. 2020;319(3):C510–32. Available from: https://journals.physiology.org/doi/10.1152/ajpcell.00181.2020.
|
| 18. |
Qaddoumi MG, Alanbaei M, Hammad MM, Al Khairi I, Cherian P, Channanath A, et al. Investigating the Role of Myeloperoxidase and Angiopoietin-like Protein 6 in Obesity and Diabetes. Sci Rep [Internet]. 2020;10(1):6170. Available from: https://www.nature.com/articles/s41598-020-63149-7.
|
| 19. |
Lin S-Y, Li W-C, Yang T-A, Chen Y-C, Yu W, Huang H-Y, et al. Optimal Threshold of Homeostasis Model Assessment of Insulin Resistance to Identify Metabolic Syndrome in a Chinese Population Aged 45 Years or Younger. Front Endocrinol (Lausanne) [Internet]. 2022;12. Available from: https://www.frontiersin.org/articles/10.3389/fendo.2021.746747/full.
|
| 20. |
JASP Team (2026). JASP (Version 0.97.1) [Computer software].
|
| 21. |
Destra E, Anggraeni N, Firmansyah Y, Santoso AH. Waist to hip ratio in Cardiovascular Disease Risk : A Review of the Literature. MAHESA Malahayati Heal Student J [Internet]. 2023;3(6):1770–81. Available from: https://ejurnalmalahayati.ac.id/index.php/MAHESA/article/view/10595.
|
| 22. |
Correction to Lancet Diabetes Endocrinol 2025; 13: 221–62. Lancet Diabetes Endocrinol [Internet]. 2025;13(3):e6. Available from: https://linkinghub.elsevier.com/retrieve/pii/S2213858725000063.
|
| 23. |
World Health Organization [Internet]. Obesity and overweight. 2025 [cited 2026 May 26]. Available from: https://www.who.int/news-room/fact-sheets/detail/obesity-and-overweight.
|
| 24. |
Aghaei M, Joukar F, Hasanipour S, Ranjbar ZA, Naghipour M, Mansour-Ghanaei F. The association between waist-to-hip ratio (WHR) with diabetes in the PERSIAN Guilan cohort study population. BMC Endocr Disord [Internet]. 2024;24(1):113. Available from: https://bmcendocrdisord.biomedcentral.com/articles/10.1186/s12902-024-01641-1.
|
| 25. |
Chan V, Cao L, Wong MMH, Lo K, Tam W. Diagnostic Accuracy of Waist-to-Height Ratio, Waist Circumference, and Body Mass Index in Identifying Metabolic Syndrome and Its Components in Older Adults: A Systematic Review and Meta-Analysis. Curr Dev Nutr [Internet]. 2024;8(1):102061. Available from: https://linkinghub.elsevier.com/retrieve/pii/S2475299123266457.
|
| 26. |
Taha BE, Majeed MJ. Estimation of Insulin Resistance in Obese Adults in Baghdad. J Fac Med Baghdad [Internet]. 2024;65(4):335–40. Available from: https://iqjmc.uobaghdad.edu.iq/index.php/19JFacMedBaghdad36/article/view/2118.
|
| 27. |
Ameen EM, Mohammed HY. Correlation between Tumor Necrosis Factor–Alfa and Anti-tyrosine Phosphatase with Obesity and Diabetes Type 2. Iraqi J Sci [Internet]. 2022;3322–31. Available from: https://ijs.uobaghdad.edu.iq/index.php/eijs/article/view/4351.
|
| 28. |
Su M, Yan M, Gong Y. Ghrelin fiber projections from the hypothalamic arcuate nucleus into the dorsal vagal complex and the regulation of glycolipid metabolism. Neuropeptides [Internet]. 2019;78:101972. Available from: https://linkinghub.elsevier.com/retrieve/pii/S0143417919300289.
|
| 29. |
Zhang SX, Kim A, Madara JC, Zhu PK, Christenson LF, Lutas A, et al. Stochastic neuropeptide signals compete to calibrate the rate of satiation. Nature [Internet]. 2025;637(8044):137–44. Available from: https://www.nature.com/articles/s41586-024-08164-8.
|
| 30. |
Park H-K, Ahima RS. Physiology of leptin: energy homeostasis, neuroendocrine function and metabolism. Metabolism [Internet]. 2015;64(1):24–34. Available from: https://linkinghub.elsevier.com/retrieve/pii/S0026049514002418.
|
| 31. |
Minakhina S, Kim SY, Wondisford FE. Regulation of hypothalamic reactive oxygen species and feeding behavior by phosphorylation of the beta 2 thyroid hormone receptor isoform. Sci Rep [Internet]. 2024;14(1):7200. Available from: https://www.nature.com/articles/s41598-024-57364-9.
|
| 32. |
Zhang Y, Chen L, Xuan Y, Zhang L, Tian W, Zhu Y, et al. Iron overload in hypothalamic AgRP neurons contributes to obesity and related metabolic disorders. Cell Rep [Internet]. 2024;43(3):113900. Available from: https://linkinghub.elsevier.com/retrieve/pii/S2211124724002286.
|
| 33. |
Lobato TB, Gennari-Felipe M, Pauferro JRB, Correa IS, Santos BF, Dias BB, et al. Leukocyte metabolism in obese type 2 diabetic individuals associated with COVID-19 severity. Front Microbiol [Internet]. 2022;13. Available from: https://www.frontiersin.org/articles/10.3389/fmicb.2022.1037469/full.
|
| 34. |
Rizo-Téllez SA, Sekheri M, Filep JG. Myeloperoxidase: Regulation of Neutrophil Function and Target for Therapy. Antioxidants [Internet]. 2022;11(11):2302. Available from: https://www.mdpi.com/2076-3921/11/11/2302.
|
| 35. |
Ndrepepa G. Myeloperoxidase – A bridge linking inflammation and oxidative stress with cardiovascular disease. Clin Chim Acta [Internet]. 2019;493:36–51. Available from: https://linkinghub.elsevier.com/retrieve/pii/S0009898119300841.
|
| 36. |
Al-Musawi HS, Al-Lami M, Al-Saadi AH. Assessment of Glycemic Control, Renal Function, and Oxidative Stress Parameters in Type 2 Diabetes MellitusPatients. Iraqi J Sci [Internet]. 2021;4628–38. Available from: https://ijs.uobaghdad.edu.iq/index.php/eijs/article/view/3613.
|
| 37. |
Mhaibes SH, Ali SH. Biomarkers of Oxidative Stress in Diabetic Microvascular Complications Review Article. Iraqi J Pharm Sci [Internet]. 2024;33(3):1–16. Available from: https://bijps.uobaghdad.edu.iq/index.php/bijps/article/view/2743.
|
| 38. |
Rubino F, Cummings DE, Eckel RH, Cohen R V, Wilding JPH, Brown WA, et al. Definition and diagnostic criteria of clinical obesity. Lancet Diabetes Endocrinol [Internet]. 2025;13(3):221–62. Available from: https://doi.org/10.1016/S2213-8587(24)00316-4.
|
