

Differential roles of the interleukin 10 family (IL-10, IL-19 and IL-22) in the pathogenesis of type 2 diabetes mellitus in Southern Saudi Arabia


Abstract
Background: Type 2 diabetes mellitus (T2DM) is a growing global health burden strongly associated with obesity and lifestyle changes. Inflammatory cytokines, particularly from the interleukin-10 (IL-10) family, are increasingly implicated in the pathogenesis of T2DM. This study assessed circulating IL-10, IL-19, and IL-22 levels in T2DM patients across obesity categories in southern Saudi Arabia.
Materials and methods: A total of 320 T2DM patients and 196 healthy controls were enrolled. All participants were classified by body mass index (BMI) as normal weight, overweight or obese (class I, class II or class III). Anthropometric and biochemical parameters were recorded, and serum IL-10, IL-19, and IL-22 levels were measured using standardized immunoassays.
Results: IL-10 levels were significantly reduced in normal weight and overweight T2DM patients of both sexes (p < 0.001) and remained lower in obesity class I (p < 0.01) and class III (p < 0.05). IL-19 levels were markedly elevated in obesity class I and class III across sexes (p < 0.001). IL-22 concentrations increased progressively with BMI, with significant elevations in obesity class I and class III groups.
Conclusions: Reduced IL-10 showed a strong association with T2DM, while higher levels in obese females suggest a possible sex-related protective effect. IL-19 was consistently associated with T2DM, whereas IL-22 correlated more closely with obesity severity.
Citation
Mir M M, Rizvi S F, Sohail S K, Mir R, Wani J I, Sabah Z U, Alremthi F A, Alharthi M, Elfaki I, Sonpol H M, Alghamdi M, Alfaifi J, AlQahtani A A. Differential roles of the interleukin 10 family (IL-10, IL-19 and IL-22) in the pathogenesis of type 2 diabetes mellitus in Southern Saudi Arabia. Eur J Transl Clin Med.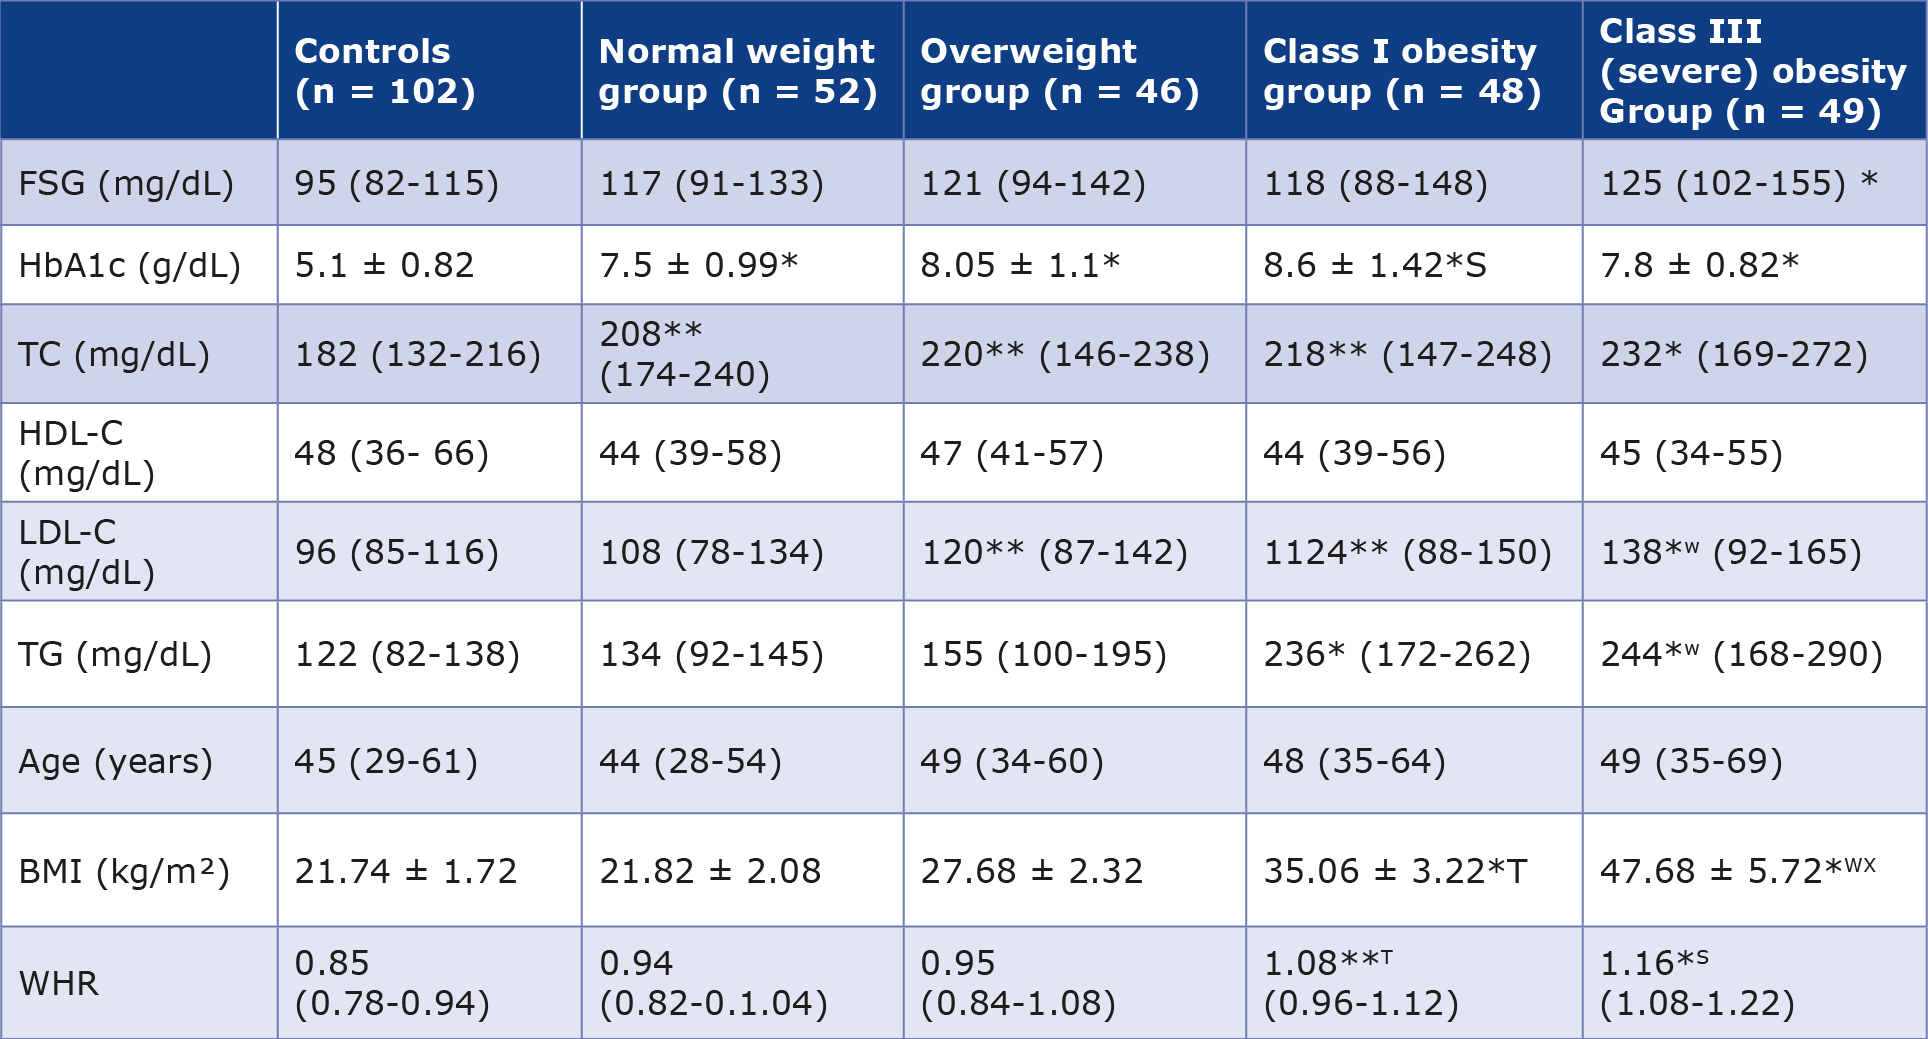


Introduction
Type 2 diabetes mellitus (T2DM) is a major global public health challenge, particularly in developing regions, driven by rapid urbanization, sedentary lifestyles, and increased consumption of calorie-dense diets [1-5]. According to the International Diabetes Federation (IDF), the global number of individuals with diabetes is projected to reach approximately 852.5 million (13% of the population) by 2045 [6]. A marked rise in prevalence has also been observed in China and other developing nations [7]. Saudi Arabia is among the top 10 countries with the highest diabetes prevalence in the world among individuals 20-79 years of age, with approximately 5.3 million cases in 2024 and projections of 9.5 million by 2050 [8]. Diabetes is a leading cause of morbidity and mortality, conferring a two- to three-fold increased risk of death [1-2]. Approximately 95% of cases are T2DM, characterized by chronic hyperglycemia resulting from impaired insulin secretion, insulin resistance, or both [8-9]. T2DM prevalence varies across populations, with higher susceptibility reported among Asian, Hispanic, Native American, and Black populations [9-13].
T2DM arises from complex interactions between genetic predisposition, environmental influences, obesity, and socioeconomic factors [14-15]. Genome-wide association studies have identified multiple loci associated with T2DM risk, primarily affecting β-cell function and insulin secretion [14-15]. Acute complications include diabetic ketoacidosis and hyperosmolar hyperglycemic state, whereas chronic complications include nephropathy, retinopathy, neuropathy, and cardiovascular disease [16]. Notably, approximately 90% of individuals with T2DM are overweight or obese, emphasizing obesity as a key modifiable risk factor [17-18].
Emerging evidence highlights the role of chronic lowgrade inflammation, adipokine imbalance, gut microbiota alterations, and immune dysregulation in T2DM pathogenesis [3, 14]. Periodontal disease has also been associated with T2DM, although the bidirectional relationship remains incompletely understood [19]. Several cytokines, particularly members of the interleukin (IL)-10 family, have been implicated in metabolic inflammation [14, 20-21]. These cytokines share structural homology and are produced by immune cells as well as adipose tissue, linking immune signaling with metabolic regulation [22-23].
IL-10 is a key anti-inflammatory cytokine that regulates inflammatory mediators including IL-19 and IL-22, and reduced circulating levels have been reported in obesity, metabolic syndrome, and T2DM [21-22]. IL-19, produced mainly by activated B cells and monocytes, can induce IL-10 production and modulate Th2 responses implicated in inflammatory and cardiovascular diseases [24-29]. It also exhibits angiogenic effects, although its role in T2DM remains incompletely defined [29-31]. IL-22, secreted by CD4+ T helper subsets and innate lymphoid cells, demonstrates functional divergence from IL10 despite structural homology.
This purpose of this study was to investigate the association between selected members of the IL-10 family, namely IL-10, IL-19, and IL-22 and the etiopathogenesis of T2DM across the degrees of obesity among the patients from the Asir (southern) region of Saudi Arabia. The study further examined correlations between obesity severity and IL levels to elucidate potential links between adiposity, metabolic control, and inflammatory-immune profiles in T2DM.
Materials and methods
Study design
This was a multi-center study of age-matched T2DM patients and healthy control pfarticipants, carried out in two cities (Bisha and Abha) of the Asir province in the southern part of Saudi Arabia. The patients and controls were recruited between March 2020 and May 2023.
Study group
In this study included only Saudi residents of the Asir region, particularly in the cities of Bisha and Abha. The study had a total of 348 patients diagnosed T2DM (210 male and 138 female). All patients were currently undergoing treatment with oral hypoglycemic agents and/or insulin. Patients with gestational diabetes or other significant chronic diseases (e.g. hypertension, cardiovascular diseases, asthma, chronic kidney diseases and cancer) were excluded from the study group.
Control group
A total of 196 healthy people (102 men and 94 women) were recruited in the study. All had fasting glucose levels, glycated hemoglobin (HbA1c), kidney and liver function tests within the reference ranges. Chronic diseases (e.g. hypertension, cardiovascular diseases, asthma, chronic kidney diseases and cancer) were also an exclusion criterion.
Ethics
This study was approved by the local RELOC Committee of the College of Medicine at the University of Bisha (Ref. No. UB-RELOC H-06-BH-087/ (0504 of 23), Dated January 6th, 2023 extended on March 4th, 2025), in accordance with the local guidelines that aligned with the fundamental principles of the Helsinki Declaration. Informed written consent was obtained from all participants.
Data collection
Finally, 320 participants with confirmed T2DM (195 males and 125 females) who visited the Diabetic Centre of King Abdullah Hospital (KAH) in Bisha, and at the Asir General Hospital (AGH) in Abha for regular follow-up and met the inclusion criteria were included in the study. T2DM was diagnosed in accordance with the WHO guidelines. The classification of obesity was based on the degree of obesity as reported earlier [3, 40]. The case histories, age, sex, BMI, blood glucose (both fasting and random), glycated hemoglobin, triacylglycerol, high-density lipoprotein-cholesterol and low-density lipoprotein-cholesterol levels were analyzed. Standardized procedures were used to evaluate the anthropometric and biochemical parameters.
Blood specimen collection
All blood samples were collected from the participants at the Diabetic Centre of KAH, and at the AGH. Venous blood samples were collected in standard sample collection tube without the use of any anticoagulants. One aliquot of serum (approximately 0.5 mL) was kept at -20 °C until the IL estimation. A second serum aliquot was used for the analysis of biochemical and other parameters on a routine basis.
Stratification on the basis of BMI
Height (cm) was recorded using a wall-mounted scale, and weight (kg) was determined with electronic weighing scale. The BMI of the patients was calculated using the formula; BMI = weight (kg)/m² (m is height in meters). The patient cohort was divided into 5 groups: normal weight (BMI 18.5-24.9), overweight (BMI 25.0-29.9), class I obesity (BMI 30.0-34.9), class II obesity (BMI 35.0-39.9), class III (severe) obesity (BMI ≥ 40.0).
Biochemical analyses
The biochemical parameters were analyzed using fully automatic random access, multi-channel analyzer (Cobas c311, Roche Diagnostics, Basel, Switzerland). For these studies we utilized commercially available test kits from (Randox Laboratories, Crumlin, Northern Ireland, UK), which included calibrators and internal quality control samples provided by the manufacturer. The manufacturers’ protocols were followed during the analysis of biochemical parameters.
Estimation of interleukins
Serum concentrations of IL-10, IL-19, and IL-22 were quantified using human ELISA kits from different sources and according to the manufacturers’ instructions. IL-10 was measured using the Human IL-10 ELISA Kit (Thermo Fisher Scientific, Carlsbad, USA, Cat. No. BMS215HS; sensitivity 0.03 pg/mL), IL-19 using the Human IL-19 ELISA Kit (AbcamLimited, Cambridge, UK; Cat. No. ab231922; sensitivity 0.65 pg/mL), and IL-22 using the Human IL-22 ELISA Kit (Thermo Fisher Scientific, Carlsbad, USA; Cat. No. BMS2047; sensitivity 5 pg/mL). Absorbance was read using a Bio-Rad Model 680 XR microplate reader (Bio-Rad Laboratories, Hercules, USA). All samples were analyzed following standardized protocols, and cytokine concentrations were expressed in pg/mL. Intra- and inter-assay coefficients of variation were < 10% for all measurements.
Statistical analyses
The Statistical Package for Social Sciences software (SPSS v. 20, IBM Corp., Armonk, USA) was used for data analysis. Unlike data with a normal distribution, which was expressed as the mean ± standard deviation (Shapiro-Wilk test), data that were not normally distributed were represented as medians (Q1–Q3) and analyzed by Chi-Square test. For normally distributed variables with homogeneous variances, the significance of differences was determined by the one-way analysis of variance with Tukey HSD test. In all other cases the Kruskal-Wallis one-way analysis of variance on ranks and the multiple comparison post hoc test were used. The p-value was considered statistically significant when it was ≤ 0.05.
Results
Baseline characteristics of male participants
The biochemical and anthropometric characteristics of male T2DM patients and controls are summarized in Table 1. Fasting glucose levels were comparable to controls in normal weight, overweight, and class I obese T2DM groups but were significantly higher in the class III obese group (p < 0.001). HbA1c levels were significantly elevated in all T2DM groups compared with controls (p < 0.001), with no significant differences among patient categories, although relatively higher values were observed in the class I obese group.
Table 1. Biochemical and anthropometric parameters of males with T2DM (n = 195) and healthy male controls (n = 102)
Values for various analytes and anthropometric parameters are presented as mean with ranges in parentheses. The values followed by ± sign represent standard deviation.
WHR – waist to hip ratio; BMI – body mass index; FSG – fasting glucose; TC – total cholesterol; HbA1c – glycated hemoglobin; HD – high density lipoprotein; LDL – low density lipoprotein; TG – triglycerides
*p < 0.001 vs. control group; **p < 0.01 vs. control group, S p < 0.001 vs. normal weight and overweight groups
T p < 0.01 vs. overweight and class I obesity; W p < 0.001 vs. controls and normal weight group; X p < 0.01 vs. class I obesity group
Total cholesterol (TC) was significantly increased in normal weight, overweight, and class I obese T2DM groups compared with controls (p < 0.01), while class III obese patients exhibited a greater elevation (p < 0.001). TC levels did not differ significantly among the first three T2DM groups. HDL levels were not significantly different between patients and controls, although a decreasing trend was observed in T2DM groups.
LDL levels were similar in controls and normal weight T2DM patients but were significantly higher in overweight and class I obese groups (p < 0.001). Class III obese patientsdemonstrated significantly higher LDL levels compared with both controls and overweight T2DM patients (p < 0.001). Triglyceride levels were significantly elevated in all T2DM groups compared with controls (p < 0.01), with the highest levels observed in class III obese patients (p < 0.001), which were also significantly greater than those in the other T2DM groups (p < 0.01).
Male T2DM patients (n = 195) aged 28-69 years were categorized according to BMI into normal weight (n = 52; 21.82 ± 2.08 kg/m²), overweight (n = 46; 27.68 ± 2.32 kg/m²), class I obese (n = 48; 35.06 ± 3.22 kg/m²), and class III obese (n = 49; 47.68 ± 5.72 kg/m²). Controls (n = 102) had a mean BMI of 21.74 ± 1.72 kg/m² (Table 1). WHR did not differ significantly between controls and normal weight or overweight T2DM patients but was significantly higher in class I and class III obese groups. Class III obese patients showed the greatest increase in WHR compared with normal weight and overweight groups (p < 0.001), while class I obese patients also demonstrated a significant increase (p < 0.01).
BMI did not differ significantly between controls and normal weight or overweight T2DM patients. However, BMI was significantly higher in class I obese patients compared with normal weight and overweight groups (p < 0.001). Class III obese patients showed the highest BMI values, significantly exceeding those of all other groups, including class I obesity (p < 0.01).
Baseline features of the female participants
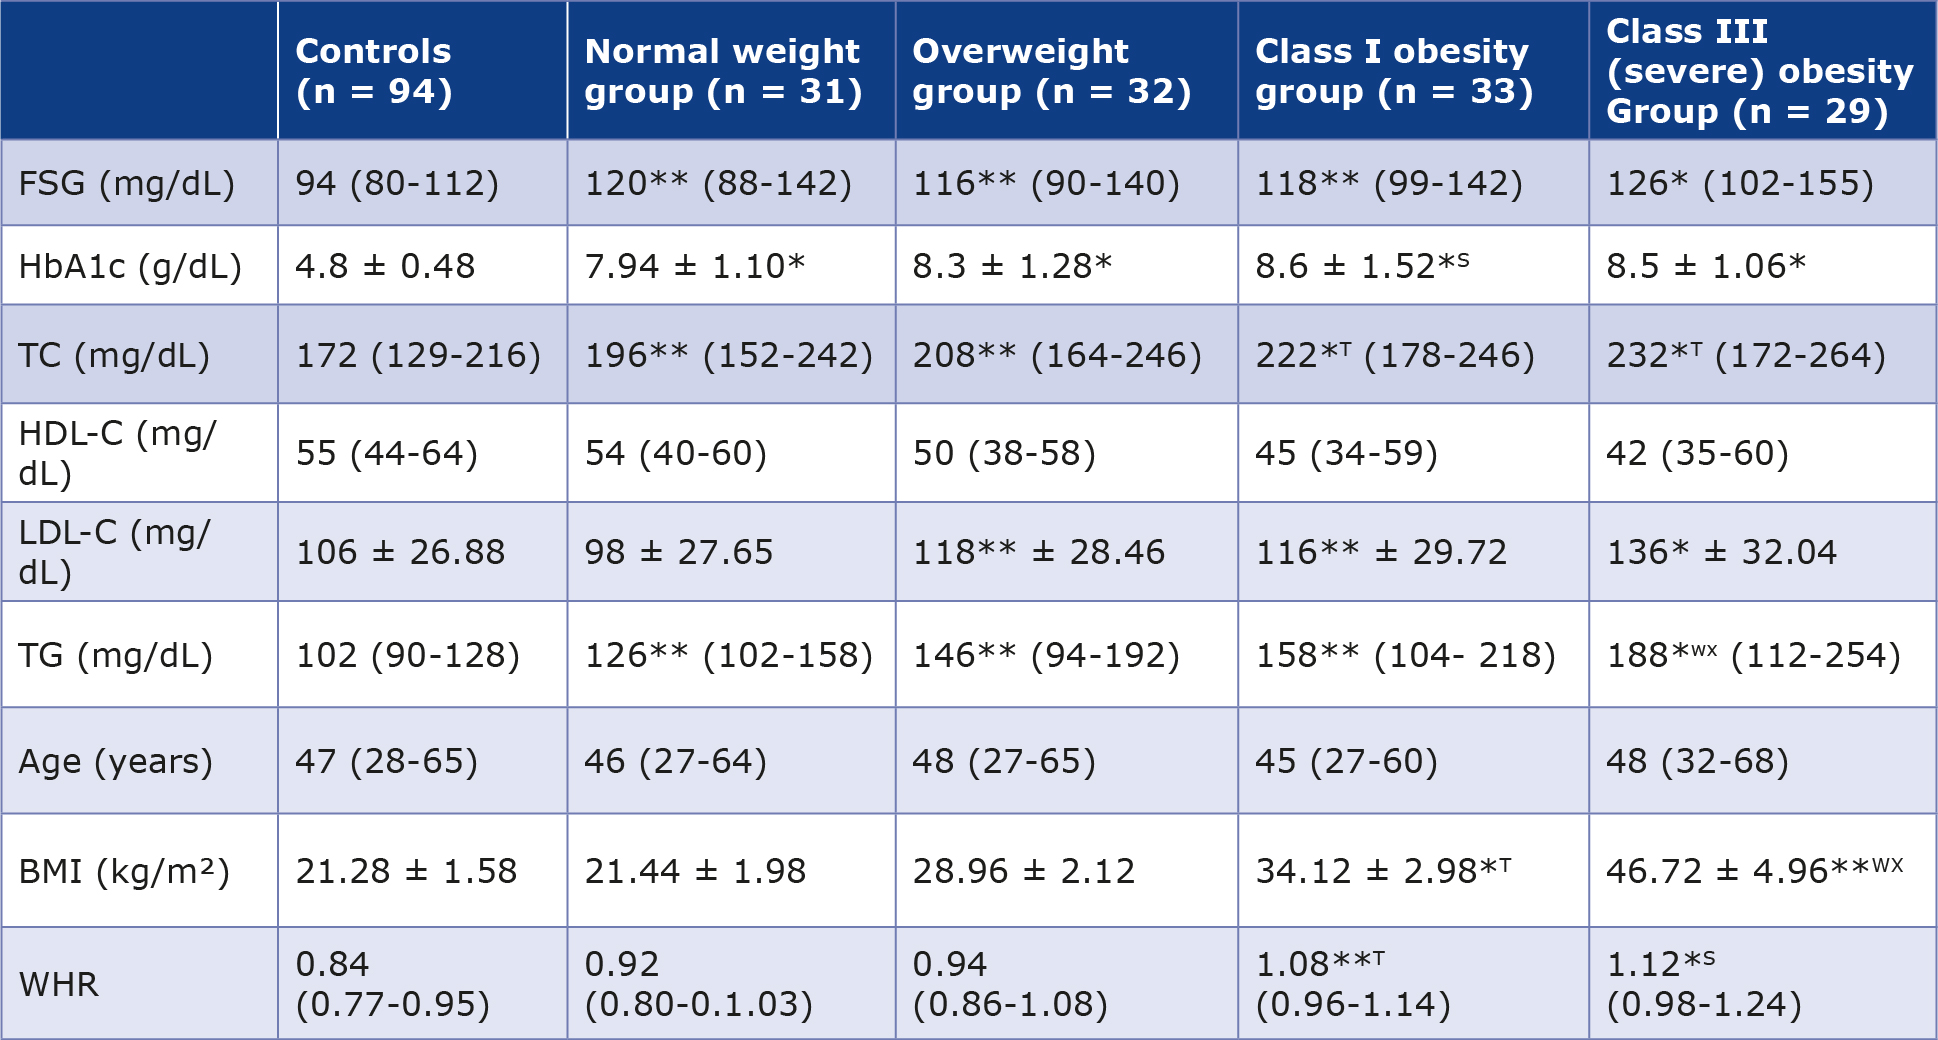
The biochemical and anthropometric characteristics of female T2DM patients and controls are summarized in Table 2. Fasting plasma glucose levels were significantly higher in normal weight, overweight, and class I obese T2DM patients compared with controls (p < 0.01), while class III obese group showed a more pronounced elevation (p < 0.001). HbA1c levels were significantly increased in all T2DM groups compared with controls (p < 0.001), with no significant differences observed among the BMI categories.
Table 2. Biochemical and anthropometric parameters of female T2DM patients (n = 125) and the female control group (n = 94)
Values for various analytes and anthropometric parameters are presented as mean with ranges in parentheses. The values followed by ± sign represent standard deviation.
FSG – fasting plasma glucose; TC – total cholesterol; HbA1c – glycated hemoglobin; HDL – high density lipoprotein; LDL – low density lipoprotein; TG – triglycerides; WHR – waist to hip ratio; BMI – body mass index
*p < 0.001 vs. control group; **p < 0.01 vs. control group, S p < 0.001 vs. normal weight and overweight groups, T p < 0.01 vs. normal
weight and overweight groups; W p < 0.001 vs. controls and normal weight group; X p < 0.01 vs. class I obesity group.
Total cholesterol (TC) levels were significantly elevated in normal weight and overweight T2DM patients compared with controls (p < 0.01), whereas class I and class III obese patients exhibited more marked increases (p < 0.001). TC levels in class I and class III obese patients were also significantly higher than those in normal weight and overweight T2DM groups (p < 0.01). HDL-cholesterol levels showed no significant differences between controls and normal weight or overweight T2DM patients, although a non-significant decrease was observed in class I and class III obese groups.
LDL-cholesterol levels were comparable between controls and normal weight T2DM patients but were significantly increased in class I and class III obese groups (p < 0.001). ClassIII obese patients demonstrated significantly higher LDL levels compared with normal weight patients (p < 0.001). Triglyceride (TG) levels were significantly elevated in normal weight, overweight, and class III obese T2DM patients compared with controls (p < 0.01), with the class III obese group showing the highest increase (p < 0.001). TG levels in class III obese patients were also significantly higher than those in normal weight and class I obese groups (p < 0.01).
Female T2DM patients ranged in age from 27-68 years, while controls ranged from 28-65 years. Based on BMI, T2DM patients were categorized into 4 groups: normal weight (n = 31; BMI 21.44 ± 1.98 kg/m²), overweight (n = 32; BMI 28.96 ± 2.12 kg/m²), class I obese (n = 33; BMI 34.12 ± 2.98 kg/m²), and class III obese (n = 29; BMI 46.72 ± 4.96 kg/m²). Controls had a mean BMI of 21.28 ± 1.58 kg/m² (Table 2).
WHR was significantly higher in class I obese (p < 0.01) and class III obese (p < 0.001) T2DM patients compared with controls. Additionally, class III obese patients exhibited significantly higher WHR compared with normal weight and overweight groups (p < 0.001). BMI did not differ significantly between controls and normal weight or overweight T2DM patients. However, BMI was significantly elevated in class I and class III obese groups compared with controls (p < 0.001). Class III obese patients demonstrated significantly higher BMI than normal weight and overweight groups (p < 0.001), as well as higher BMI compared with class I obese patients (p < 0.01). Class I obese patients also showed significantly higher BMI than normal weight and overweight groups (p < 0.01).
Interleukin levels in male participants
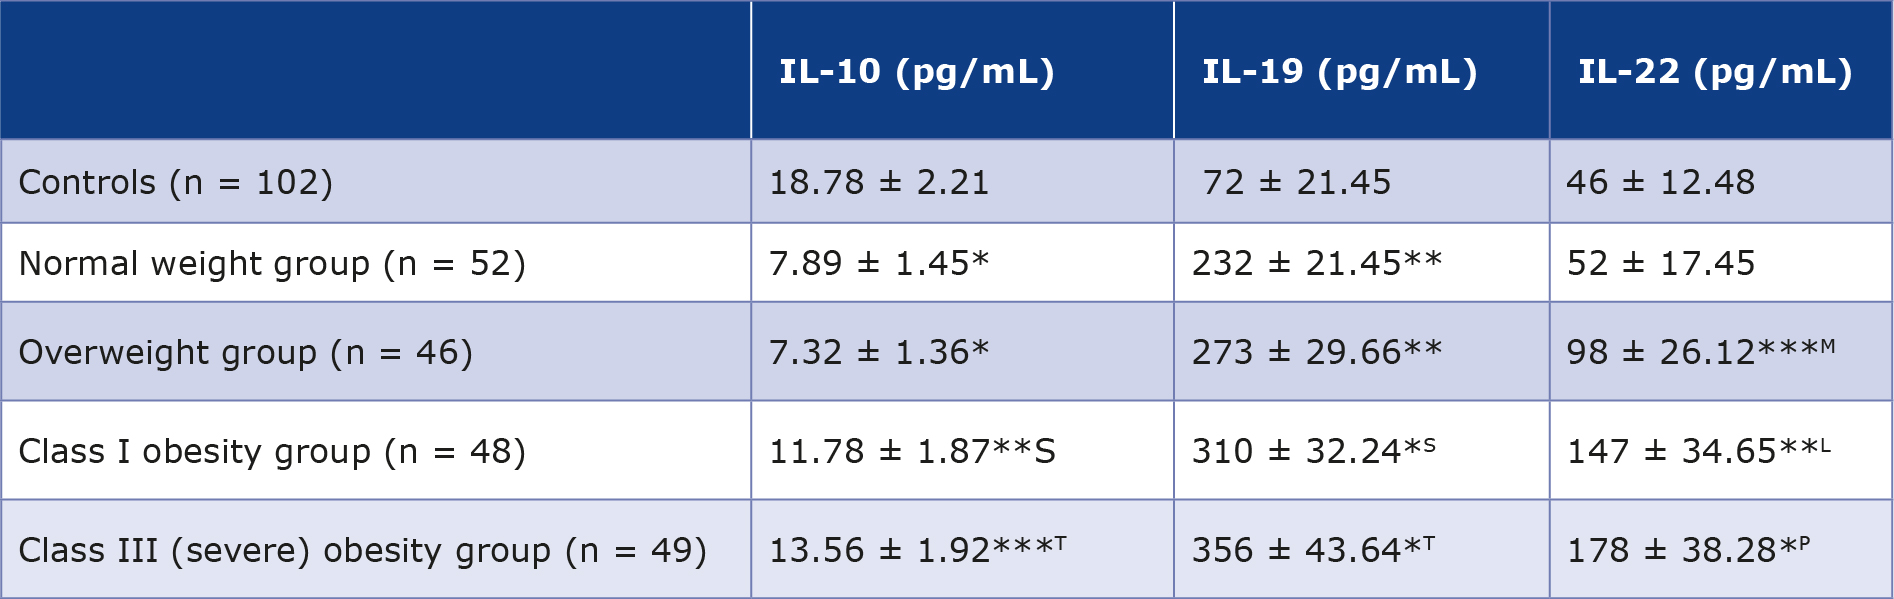
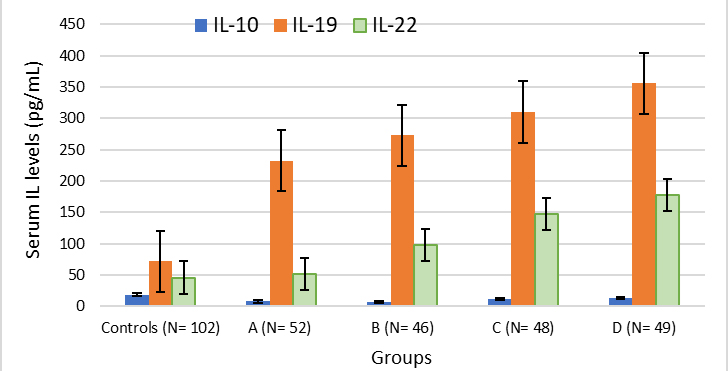
Table 3 presents a summary of the blood concentrations of IL 10, 19 and 22 and the results are graphically depicted in Figure 1.
Table 3. Serum levels of IL 10, 19 and 22 in male T2DM patients (n = 195) and normal controls (n = 102)
Values for various analytes are presented as mean with ranges in parentheses ± standard deviation.
*p < 0.001 vs. control group; ** p < 0.01 vs. control group; *** p < 0.05 vs. control group; Lp < 0.04 vs. overweight group; Sp < 0.05 compared to normal weight and overweight T2DM patients; Tp < 0.05 compared to normal weight and overweight T2DM patients; M p < 0.05 compared to controls and normal weight group; N p < 0.01 compared to controls and normal weight group; Pp < 0.001 compared to controls and normal weight group.
Figure 1. Cluster charts of IL 10, 19 and 22 levels in male controls and T2DM patients. A represents T2DM patients with normal weight; B represents overweight group; C represents class I obeseity group and D represents class III obesity group respectively.
Interleukin-10 in male participants
The average blood IL-10 concentration in the control group of healthy males (n = 102) was 18.78 ± 2.21 pg/mL. T2DM patients in normal weight and overweight groups exhibited significant reductions (p < 0.001) in IL-10 levels, measuring 7.89 ± 1.45 and 7.32 ± 1.36 pg/mL, respectively, as compared to the control group. T2DM patients in in class I and III obesity groups had statistically significant reductions in IL-10 levels (11.78 ± 1.87 and 13.56 ± 1.92 pg/mL, respectively) when compared to the control group. The p values for these comparisons were < 0.01 and < 0.05, respectively. The IL-10 levels of class I and III obesity groups were significantly higher than those in normal weight and overweight groups (p < 0.05).
Interleukin-19
The IL-19 level (mean ± SD) in the male controls (n = 102) was 72 ± 21.45 pg/mL. Male T2DM patients in in normal weight and overweight groups had a statistically significant increase (p < 0.01) in IL-19 concentrations (232 ± 21.45 and 273 ± 29.66 pg/mL) respectively, as compared to controls. T2DM patients in class I and III obesity groups displayed very significant increases in IL-19 values (310 ± 32.24 and 356 ± 43.64 pg/ mL respectively) in comparison with controls with p values of < 0.001 and < 0.001. Patients in class I and III obesity groups also had significantly greater IL-19 levels in comparison with those in normal weight and overweight groups (p < 0.05).
Interleukin-22 in male participants
The average serum IL-22 concentration in the male controls (n = 102) was 46 ± 12.48 pg/mL. The T2DM patients with normal weight exhibited a slight, albeit statistically insignificant elevation in IL-22 levels (52 ± 17.45 versus 46 ± 12.48 pg/mL). Overweight patients also had significant elevation in IL-22 levels in comparison to both the control group and normal weight group (p < 0.05). The levels of IL-22 in class I obesity group exhibited a statistically significant rise when contrasted with controls, p < 0.01. Class I obesity T2DM patients had a notable increase in IL-22 levels in comparison to overweight T2DM patients, with p < 0.04. While comparing to both the controls and normal weight group, IL-22 levels were considerably greater in patients with class III obesity (p < 0.001). Figure 1 presents the cluster charts depicting the levels of serum IL 10 family members in both male control and patient groups.
Interleukin-10 in female groups
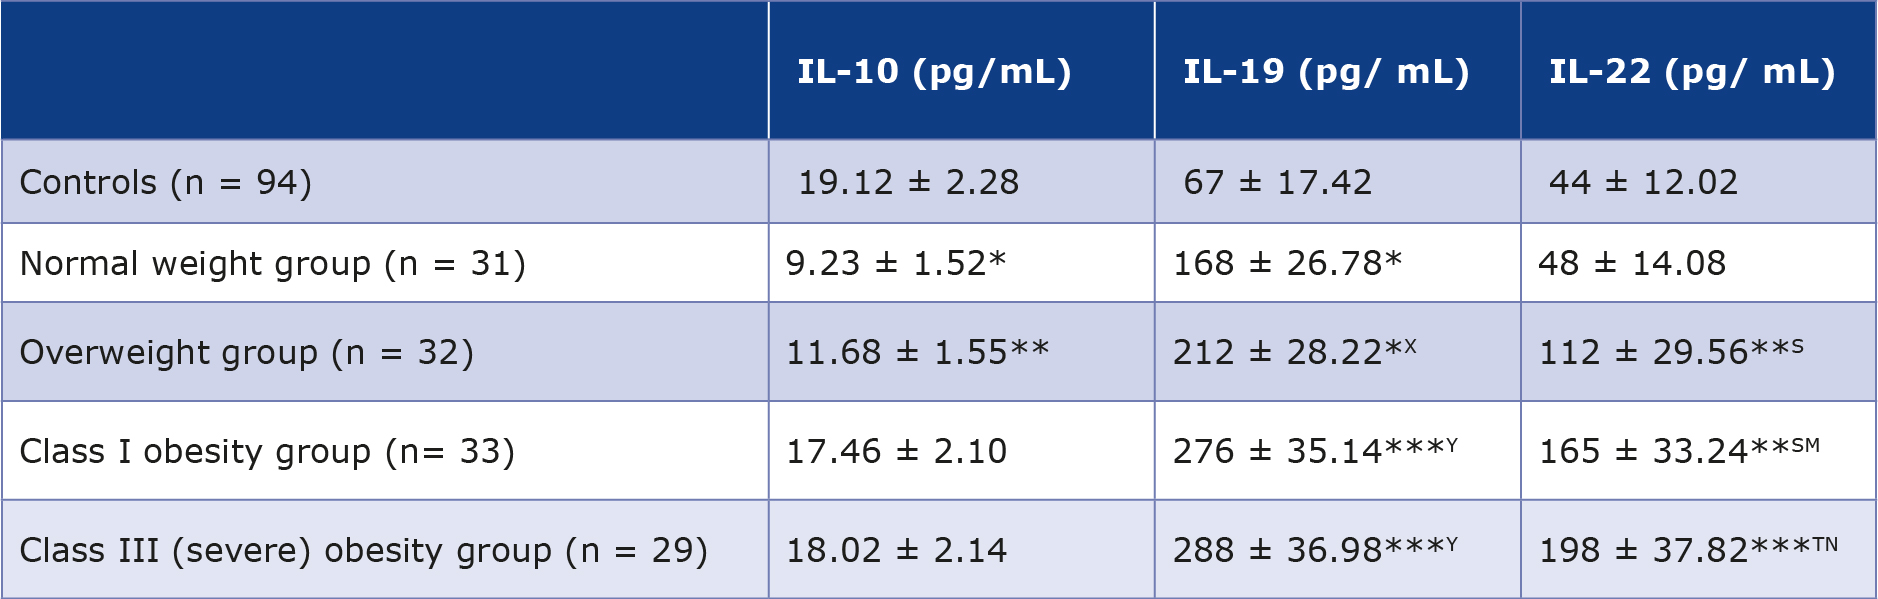
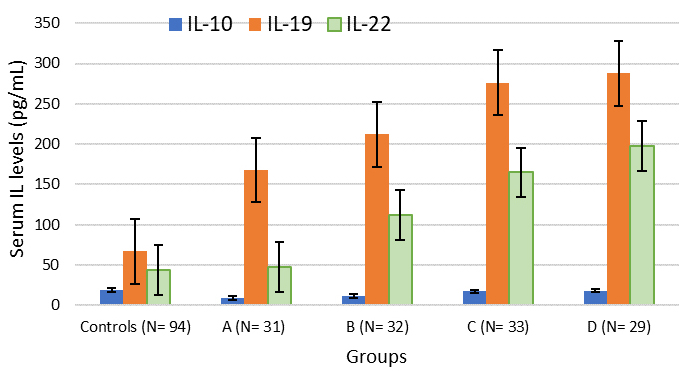
Table 4 provides a summary of the serum levels of IL 10, 19 and 22 in T2DM female patients (n = 125) and 94 individuals serving as control subjects. The average serum IL-10 concentration in the control group of healthy females was 19.12 ± 2.28 pg/mL, a value comparable to that observed in the control group of males. Normal weight female T2DM patients exhibited a statistically significant reduction (p < 0.001) in IL-10 concentrations as compared to the control subjects. The female patients in overweight group exhibited a noteworthy reduction in IL-10 levels (11.68 ± 1.55 pg/mL) in contrast to controls, with p < 0.01. T2DM patients with class I and III obesity showed a slight, albeit statistically insignificant reduction in IL-10 levels in comparison with the controls. The results for female subjects are summarized in table 4 and are graphically illustrated in Figure 2.
Table 4. Serum levels of IL 10, 19 and 22 in female T2DM patients (n = 125) and normal controls (n = 94)
Values for various analytes are presented as mean with ranges in parentheses ± standard deviation.
*p < 0.001 vs. control group; ** p < 0.01 vs. control group; *** p < 0.0001 vs. control group; X p < 0.01 compared to normal weight patient group; Y p < 0.001 compared to normal weight patient group; S p < 0.01 compared to controls and normal weight patient group;
T p < 0.001 compared to normal weight patient group and controls; M p < 0.04 compared to overweight patients; N p < 0.01 compared to overweight patient group
Figure 2. Cluster charts of IL 10, 19 and 22 levels in female controls and T2DM patients. A represents normal weight group; B represents overweight group; C represents class I obesity group and D represents class III obesity group of T2DM patients.
Interleukin-19 in female T2DM patients
The average blood IL-19 concentration in the female control group (n = 94) was 67 ± 17.42 pg/mL. Female T2DM normal weight and overweight patients exhibited statistically significant increases in IL-19 concentrations (168 ± 26.78 and 212 ± 28.22 pg/mL, respectively) in comparison to controls with p < 0.01. Simultaneously, it was observed that overweight T2DM patients exhibited significantly higher IL-19 levels in comparison to normal weight patients (p < 0.01). Patients with class I and III obesity exhibited a very significant elevation in IL-19 levels (276 ± 35.14 and 288 ± 36.98 pg/ mL, respectively) when contrasted with controls (p < 0.0001). In addition, IL-19 levels were significantly higher in class I and III obesity groups compared to the normal weight group (p < 0.001).
Interleukin-22 in female T2DM patients
The average blood IL-22 concentration in the control group of healthy females (n = 94) was 44 ± 12.02 pg/mL as are presented in Table 4. The patients with normal weight exhibited a small and statistically insignificant rise in IL-22 levels (48 ± 14.08 versus 44 ± 12.02 pg/mL). Overweight patients with T2DM had a statistically significant (p < 0.01) elevation in IL-22 levels in comparison to both the controls and patients with normal weight. IL-22 values in patient group with class I obesity exhibited a statistically significant rise in comparison to the controls, as well as normal weight and overweight patients, with p values < 0.01, < 0.01, and < 0.04, respectively. The IL-22 levels in patients with class III obesity were significantly higher than those in the controls (p < 0.001), and also, those of normal weight group A (p < 0.001) and overweight group p < 0.04). The cluster charts of serum IL concentrations in 74 female patients and 41 controls are displayed in Figure 2.
Sex-based comparison of IL levels
Comparative analysis of serum IL levels between male and female T2DM patients revealed distinct sex-related patterns across BMI categories. IL-10 levels were significantly reduced in normal-weight and overweight patients of both sexes compared with controls, however, suppression was more pronounced in males (7.32-7.89 pg/mL) than females (9.23-11.68 pg/mL). With increasing obesity severity, IL-10 levels showed partial restoration, approaching control values more closely in females than males. IL-19 concentrations were markedly elevated across all BMI categories in both groups, with a substantially greater increase observed in males (232-356 pg/mL) compared to females (168-288 pg/mL). IL-22 levels demonstrated a progressive rise with increasing adiposity in both sexes. Although both sexes exhibited significant elevations in overweight and obese categories, males showed higher levels in most BMI strata, while severely obese females demonstrated comparable peak values. Overall, male T2DM patients exhibited a stronger pro-inflammatory IL profile, whereas females demonstrated partial preservation of anti-inflammatory IL-10 with increasing adiposity.
IL levels in all T2DM patients (male & female) vs. controls
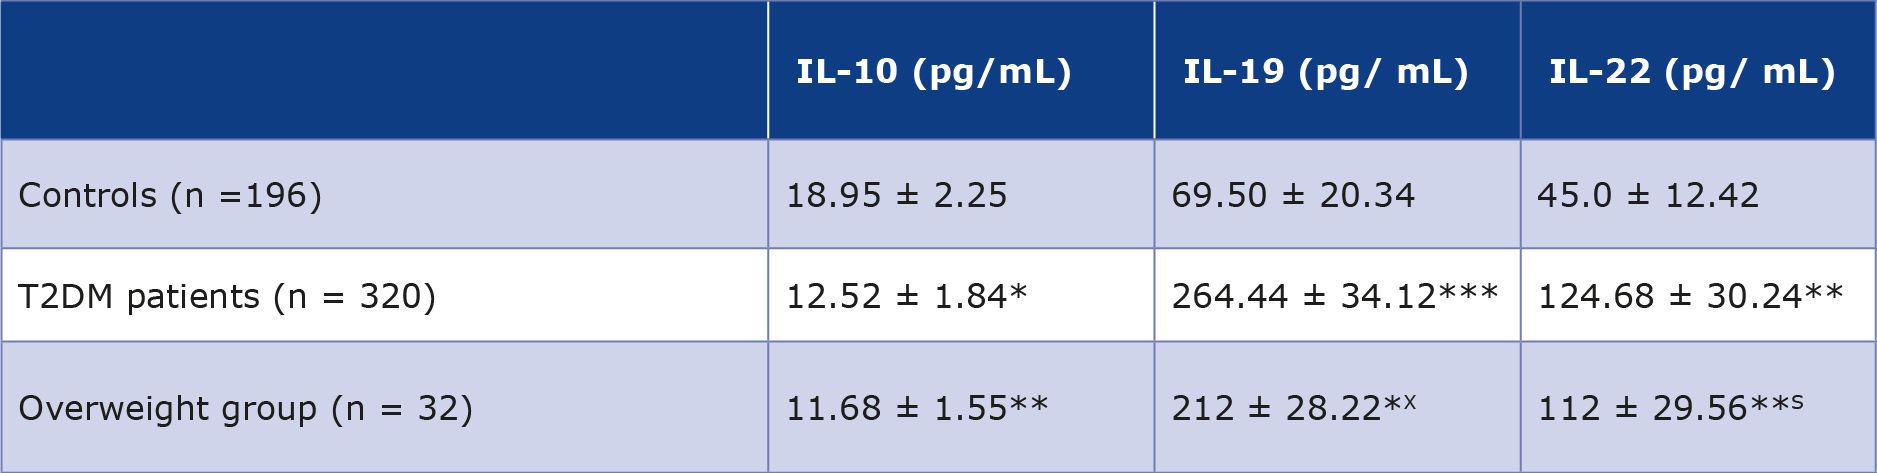
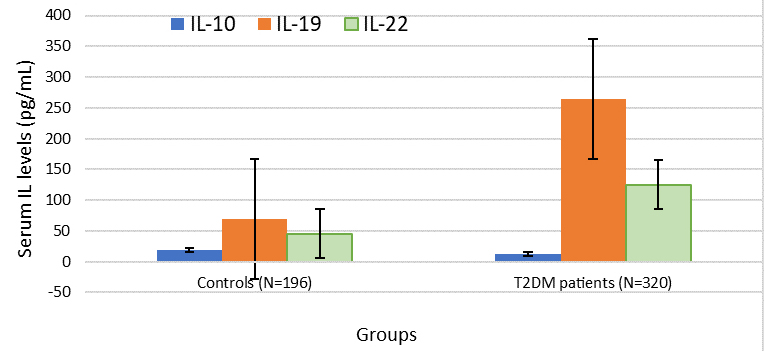
A comparison of the serum levels of ILs 10, 19 and 22 in T2DM patients with controls has been summarized in Table 5 and the results are graphically presented in Figure 3. The average serum IL-10 concentration in T2DM patients was 12.52 ± 1.84 pg/mL as compared to 18.95 ± 2.25 pg/mL for those of controls showing a statistically significant decrease in IL-10 levels with p < 0.01. The average serum IL-19 concentration in T2DM patients was 264.44 ± 34.12 pg/mL in comparison to69.50 ± 20.34 pg/mL for those of controls, showing a statistically significant increase in IL-19 levels with p < 0.0001. The serum IL-22 level in T2DM patients was 124.68 ± 30.24 pg/mL as compared to 45.0 ± 12.42 pg/mL for those of controls, depicting a very significant increase in IL-19 levels with p < 0.001.
Table 5. Comparison of serum levels of ILs 10, 19, and 22 of all T2DM patients (males and females combined n = 320) with normalcontrols (= 196)
* Values for various analytes are presented as mean with ranges in parentheses ± standard deviation.
p < 0.01 for combined patients vs. control group; ** p < 0.001 for combined patients vs. control group; *** p < 0.0001 for combined patients vs. control group
Figure 3. Cluster charts of IL 10, 19 and 22 levels in combined controls (n = 196) and T2DM patients (n = 320)
Discussion
To the best of our knowledge, this is the first study to explore the interplay between obesity-related anthropometric measures and IL-10 family cytokines in the context of T2DM in the population of the Asir region of Saudi Arabia.
IL-10 levels were comparable between male (n = 102) and female (n = 94) controls, in agreement with previous studies [21, 23, 32-33]. In contrast, normal-weight T2DM patients demonstrated a significant reduction in IL-10, suggesting a diminished anti-inflammatory milieu that may contribute to disease onset [21, 23, 33]. Among overweight individuals, male patients showed a marked decline in IL-10 (p < 0.001), while females exhibited a more modest reduction. The anti-inflammatory role of IL-10 is well-established [21-22, 24], and it is often viewed as protective in metabolic disorders, although excessively elevated levels may have paradoxical effects [22]. Notably, IL-10 levels were significantly reduced in class I and III obese males, whereas females in the same categories showed comparatively higher levels (p < 0.01). This divergence reinforces the role of obesity as an independent risk factor and points toward a possible attenuation of anti- -inflammatory signaling in males. Similar patterns have been described previously [34].
Sex-based differences in cytokine responses are well documented [35-37]. The relatively higher IL-10 levels observed in obese females may be influenced by sex hormones, particularly given the role of adipose tissue in hormone metabolism [34, 37-40]. Elevated IL-10 levels in post-menopausal women further support this association [34, 40]. These observations warrant deeper exploration, and comparisons between pre- and post-menopausal states are being addressed in our ongoing work.
The mechanisms underlying elevated IL-10 in obese female T2DM patients remain incompletely understood but may involve transcriptional regulation [34]. It is plausible that this reflects a compensatory anti-inflammatory response, however this speculation requires further validation.
IL-19, a structurally distinct member of the IL-10 family with an α-helical configuration [26], has increasingly been implicated in metabolic disorders [29, 40]. In our study, IL-19 levels were significantly altered across all T2DM groups, irrespective of sex, consistently with prior reports [29, 40]. Patients with class I and III obesity exhibited marked elevations compared to both controls and normal-weight T2DM individuals (p < 0.001), suggesting a role not only in T2DM but also in the gradation of obesity [29, 40]. IL-19 has been associated with anti-inflammatory, antiatherogenic, and vasculoprotective effects, indicating potential clinical relevance [26,41-44]. However, these observations need confirmation in larger,well-characterized cohorts [41, 44]. IL-22 demonstrated a progressive increase across T2DM groups, with statistically significant elevations primarily in overweight and obese individuals, aligning with earlier findings [45-46]. These results support the view that IL-22 alone may not serve as a definitive biomarker for T2DM, and its levels appear largely independent of sex hormones [45-46]. IL-22 signals through a receptor complex comprising IL-22R1 and IL-10R2, the latter also shared by IL-10, IL-26, IL-28, and IL-29 [45]. When analyzed collectively, T2DM patients showed significant alterations in all three interleukins compared to controls, consistently with existing literature [22, 27, 47-48].
Previous studies have reported higher IL-22 levels and increased frequencies of IL-22-producing CD4+ T cells in insulin-resistant and obese individuals, although many of these studies are limited by small sample sizes and lack of replication [46, 49-50]. Experimental models suggest that IL-22 may mitigate oxidative and endoplasmic reticulum stress, and exogenous IL-22 has shown beneficial metabolic effects in animal studies [46, 51]. Unfortunately, human data remain limited. There is a clear need for carefully designed translational studies to better define the role of IL-22 in T2DM and to assess its potential as a therapeutic target.
Limitations
All the T2DM patients enrolled for this study belonged to one ethnic group which limits the generalizability of our results. Additional investigations using larger sample sizes in multiple ethnic groups are necessary to explore the IL-10 family’s role in the pathogenesis of T2DM and its potential therapeutic value. Another limitation of this study is the fact that our control group did not include a sub-group of obese participants without T2DM.
Conclusions
IL-10 levels were significantly reduced in both male and female normal-weight T2DM patients compared to controls. With increasing adiposity, males consistently showed lower IL-10 levels than females, while females in class I and III obesity groups exhibited relatively higher levels within comparable metabolic categories. IL-19 levels were significantly elevated across all T2DM groups, irrespective of sex, with a more pronounced increase in obese and severely obese patients compared to controls and normal-weight individuals, indicating a potential role in both T2DM and obesity.
IL-22 levels showed a progressive rise across T2DM groups, although significant changes were limited to overweight and obese categories, suggesting a stronger association with obesity rather than with T2DM per se.
Conflict of interest
None
Acknowledgments
The authors are thankful to the Deanship of Graduate Studies and Scientific Research at the University of Bisha for supporting this work through the Fast-Track Research Support Program.
Data availability statement
Data used in this study is available upon reasonable request.
References
| 1. |
Huang X, Wu Y, Ni Y, Xu H, He Y. Global, regional, and national burden of type 2 diabetes mellitus caused by high BMI from 1990 to 2021, and forecasts to 2045: analysis from the global burden of disease study 2021. Front Public Heal [Internet]. 2025;13:151579. Available from: https://www.frontiersin.org/journals/public-health/articles/10.3389/fpubh.2025.1515797.
|
| 2. |
Ba T, Ren Q, Gong S, Li M, Lian H, Cai X, et al. Prevalence and Clinical Characteristics of NEUROD1-MODY in Chinese Early-Onset Type 2 Diabetes Mellitus and a Literature Review. J Diabetes [Internet]. 2025;17(4):e70080. Available from: https://doi.org/10.1111/1753-0407.70080.
|
| 3. |
Mir MM, Mir R, Alghamdi MAA, Wani JI, Sabah ZU, Jeelani M, et al. Differential Association of Selected Adipocytokines, Adiponectin, Leptin, Resistin, Visfatin and Chemerin, with the Pathogenesis and Progression of Type 2 Diabetes Mellitus (T2DM) in the Asir Region of Saudi Arabia: A Case Control Study. J Pers Med [Internet]. 2022;12(5):735. Available from: https://www.mdpi.com/2075-4426/12/5/735.
|
| 4. |
Mir M, Mir R, Alghamdi M, Wani J, Elfaki I, Sabah Z, et al. Potential impact of GCK , MIR-196A-2 and MIR-423 gene abnormalities on the development and progression of type 2 diabetes mellitus in Asir and Tabuk regions of Saudi Arabia. Mol Med Rep [Internet]. 2022;25(5):162. Available from: http://www.spandidos-publications.com/10.3892/mmr.2022.12675.
|
| 5. |
Qadir MI, Ahmed Z. lep Expression and Its Role in Obesity and Type-2 Diabetes. Crit Rev Eukaryot Gene Expr [Internet]. 2017;27(1):47–51. Available from: http://www.dl.begellhouse.com/journals/6dbf508d3b17c437,7963fdcd2773abac,7c1a039e7f33b3cb.html.
|
| 6. |
Magliano D, Boyko E. The global picture of diabetes. In: Diabetes Atlas [Internet]. 11th ed. Brussels: International Diabetes Federation; 2025. Available from: https://www.ncbi.nlm.nih.gov/books/NBK618744/.
|
| 7. |
Zhou X, Guan H, Zheng L, Li Z, Guo X, Yang H, et al. Prevalence and awareness of diabetes mellitus among a rural population in China: results from Liaoning Province. Diabet Med [Internet]. 2015;32(3):332–42. Available from: https://onlinelibrary.wiley.com/doi/10.1111/dme.12599.
|
| 8. |
Moin ASM, Butler AE. Alterations in Beta Cell Identity in Type 1 and Type 2 Diabetes. Curr Diab Rep [Internet]. 2019;19(9):83. Available from: http://link.springer.com/10.1007/s11892-019-1194-6.
|
| 9. |
Yin J, Yeung R, Luk A, Tutino G, Zhang Y, Kong A, et al. Gender, diabetes education, and psychosocial factors are associated with persistent poor glycemic control in patients with type 2 diabetes in the J oint A sia D iabetes E valuation ( JADE ) program. J Diabetes [Internet]. 2016;8(1):109–19. Available from: https://onlinelibrary.wiley.com/doi/10.1111/1753-0407.12262.
|
| 10. |
Liu M, Lv X, Li Y, Li J, He Y. Prevalence and Control Status of Diabetes and Related Risk Factors Among 4196 Chinese Male Older Elderly Aged ≥80 Years. Int J Gerontol [Internet]. 2018;12(2):122–6. Available from: https://linkinghub.elsevier.com/retrieve/pii/S1873959816302083.
|
| 11. |
Wang H, Yao J, Yin X, Guo X, Yin J, Qu H, et al. Organisational and individual characteristics associated with glycaemic control among patients with type 2 diabetes: cross-sectional study in China. BMJ Open [Internet]. 2020;10(4):e036331. Available from: https://bmjopen.bmj.com/lookup/doi/10.1136/bmjopen-2019-036331.
|
| 12. |
Irazola V, Rubinstein A, Bazzano L, Calandrelli M, Chung-Shiuan C, Elorriaga N, et al. Prevalence, awareness, treatment and control of diabetes and impaired fasting glucose in the Southern Cone of Latin America. Alway SE, editor. PLoS One [Internet]. 2017;12(9):e0183953. Available from: https://dx.plos.org/10.1371/journal.pone.0183953.
|
| 13. |
Hu D, Fu P, Xie J, Chen C-S, Yu D, Whelton PK, et al. Increasing prevalence and low awareness, treatment and control of diabetes mellitus among Chinese adults: The InterASIA study. Diabetes Res Clin Pract [Internet]. 2008;81(2):250–7. Available from: https://linkinghub.elsevier.com/retrieve/pii/S0168822708001897.
|
| 14. |
Galicia-Garcia U, Benito-Vicente A, Jebari S, Larrea-Sebal A, Siddiqi H, Uribe KB, et al. Pathophysiology of Type 2 Diabetes Mellitus. Int J Mol Sci [Internet]. 2020;21(17):6275. Available from: https://www.mdpi.com/1422-0067/21/17/6275.
|
| 15. |
Abdul-Ghani MA, Jayyousi A, DeFronzo RA, Asaad N, Al-Suwaidi J. Insulin Resistance the Link between T2DM and CVD: Basic Mechanisms and Clinical Implications. Curr Vasc Pharmacol [Internet]. 2019;17(2):153–63. Available from: http://www.eurekaselect.com/156313/article.
|
| 16. |
Forbes JM, Cooper ME. Mechanisms of Diabetic Complications. Physiol Rev [Internet]. 2013;93(1):137–88. Available from: https://www.physiology.org/doi/10.1152/physrev.00045.2011.
|
| 17. |
Niu G, Li J, Wang H, Ren Y, Bai J. Associations of A-FABP with Anthropometric and Metabolic Indices and Inflammatory Cytokines in Obese Patients with Newly Diagnosed Type 2 Diabetes. Biomed Res Int [Internet]. 2016;2016:1–6. Available from: https://www.hindawi.com/journals/bmri/2016/9382092/.
|
| 18. |
Urbanavičius V, Abalikšta T, Brimas G, Abraitienė A, Gogelienė L, Strupas K. Comparison of changes in blood glucose, insulin resistance indices, and adipokine levels in diabetic and nondiabetic subjects with morbid obesity after laparoscopic adjustable gastric banding. Medicina (B Aires) [Internet]. 2013;49(1):2. Available from: https://medicina.lsmuni.lt/med/1301/1301-02e.pdf.
|
| 19. |
Păunică I, Giurgiu M, Dumitriu AS, Păunică S, Pantea Stoian AM, Martu M-A, et al. The Bidirectional Relationship between Periodontal Disease and Diabetes Mellitus—A Review. Diagnostics [Internet]. 2023;13(4):681. Available from: https://www.mdpi.com/2075-4418/13/4/681.
|
| 20. |
Brocker C, Thompson D, Matsumoto A, Nebert DW, Vasiliou V. Evolutionary divergence and functions of the human interleukin (IL) gene family. Hum Genomics [Internet]. 2010;5(1):30. Available from: https://doi.org/10.1186/1479-7364-5-1-30.
|
| 21. |
Iyer SS, Cheng G. Role of Interleukin 10 Transcriptional Regulation in Inflammation and Autoimmune Disease. Crit Rev Immunol [Internet]. 2012;32(1):23–63. Available from: http://www.dl.begellhouse.com/journals/2ff21abf44b19838,76944bab5ddebfc1,2a93e3a12bdb71e5.html.
|
| 22. |
van Exel E, Gussekloo J, de Craen AJM, Frölich M, Bootsma-van der Wiel A, Westendorp RGJ. Low Production Capacity of Interleukin-10 Associates With the Metabolic Syndrome and Type 2 Diabetes. Diabetes [Internet]. 2002;51(4):1088–92. Available from: https://diabetesjournals.org/diabetes/article/51/4/1088/34607/Low-Production-Capacity-of-Interleukin-10.
|
| 23. |
Snijder MB, Heine RJ, Seidell JC, Bouter LM, Stehouwer CDA, Nijpels G, et al. Associations of Adiponectin Levels With Incident Impaired Glucose Metabolism and Type 2 Diabetes in Older Men and Women. Diabetes Care [Internet]. 2006;29(11):2498–503. Available from: https://diabetesjournals.org/care/article/29/11/2498/24584/Associations-of-Adiponectin-Levels-With-Incident.
|
| 24. |
Hofmann SR, Rösen-Wolff A, Tsokos GC, Hedrich CM. Biological properties and regulation of IL-10 related cytokines and their contribution to autoimmune disease and tissue injury. Clin Immunol [Internet]. 2012;143(2):116–27. Available from: https://linkinghub.elsevier.com/retrieve/pii/S1521661612000642.
|
| 25. |
Jordan WJ, Eskdale J, Boniotto M, Lennon GP, Peat J, Campbell JDM, et al. Human IL‐19 regulates immunity through auto‐induction of IL‐19 and production of IL‐10. Eur J Immunol [Internet]. 2005;35(5):1576–82. Available from: https://onlinelibrary.wiley.com/doi/10.1002/eji.200425317.
|
| 26. |
Ray M, Autieri M V. Regulation of pro- and anti-atherogenic cytokines. Cytokine [Internet]. 2019;122:154175. Available from: https://linkinghub.elsevier.com/retrieve/pii/S1043466617302892.
|
| 27. |
Jain S, Gabunia K, Kelemen SE, Panetti TS, Autieri M V. The Anti-Inflammatory Cytokine Interleukin 19 Is Expressed By and Angiogenic for Human Endothelial Cells. Arterioscler Thromb Vasc Biol [Internet]. 2011;31(1):167–75. Available from: https://www.ahajournals.org/doi/10.1161/ATVBAHA.110.214916.
|
| 28. |
England RN, Autieri M V. Anti-Inflammatory Effects of Interleukin-19 in Vascular Disease. Int J Inflam [Internet]. 2012;2012:1–10. Available from: http://www.hindawi.com/journals/iji/2012/253583/.
|
| 29. |
Li L, ZHeng‐Qing Y, Juan‐Yu H, Jian‐Yong X, Fan L, Guang‐Chun Z, et al. Association between interleukin‐19 and angiopoietin‐2 with vascular complications in type 2 diabetes. J Diabetes Investig [Internet]. 2016;7(6):895–900. Available from: https://onlinelibrary.wiley.com/doi/10.1111/jdi.12519.
|
| 30. |
Li L, Yu Zh-Q, Qian L, Xu J-Y, Liu F, Zhao G-C, et al. Interleukin-19 and angiopoietin-2 can enhance angiogenesis of diabetic complications. J Diabetes Complications [Internet]. 2016;30(2):386–7. Available from: https://linkinghub.elsevier.com/retrieve/pii/S1056872715004390.
|
| 31. |
Chen J, Caspi RR, Chong WP. IL-20 receptor cytokines in autoimmune diseases. J Leukoc Biol [Internet]. 2018;104(5):953–9. Available from: https://academic.oup.com/jleukbio/article/104/5/953/6935471.
|
| 32. |
Yaghini N, Mahmoodi M, Asadikaram GR, Hassanshahi GH, Khoramdelazad H, Arababadi MK. Serum levels of interleukin 10 (IL-10) in patients with type 2 diabetes. Iran Red Crescent Med J [Internet]. 2011;13(10):752. Available from: https://pmc.ncbi.nlm.nih.gov/articles/PMC3371882/.
|
| 33. |
Giulietti A, van Etten E, Overbergh L, Stoffels K, Bouillon R, Mathieu C. Monocytes from type 2 diabetic patients have a pro-inflammatory profile. Diabetes Res Clin Pract [Internet]. 2007;77(1):47–57. Available from: https://linkinghub.elsevier.com/retrieve/pii/S0168822706004736.
|
| 34. |
Subramanian N, Tavira B, Hofwimmer K, Gutsmann B, Massier L, Abildgaard J, et al. Sex-specific regulation of IL-10 production in human adipose tissue in obesity. Front Endocrinol (Lausanne) [Internet]. 2022;13. Available from: https://www.frontiersin.org/articles/10.3389/fendo.2022.996954/full.
|
| 35. |
Cartier A, Côté M, Lemieux I, Pérusse L, Tremblay A, Bouchard C, et al. Sex differences in inflammatory markers: what is the contribution of visceral adiposity? Am J Clin Nutr [Internet]. 2009;89(5):1307–14. Available from: https://linkinghub.elsevier.com/retrieve/pii/S0002916523237880.
|
| 36. |
Camporez JP, Lyu K, Goldberg EL, Zhang D, Cline GW, Jurczak MJ, et al. Anti‐inflammatory effects of oestrogen mediate the sexual dimorphic response to lipid‐induced insulin resistance. J Physiol [Internet]. 2019;597(15):3885–903. Available from: https://physoc.onlinelibrary.wiley.com/doi/10.1113/JP277270.
|
| 37. |
Shepherd R, Cheung AS, Pang K, Saffery R, Novakovic B. Sexual Dimorphism in Innate Immunity: The Role of Sex Hormones and Epigenetics. Front Immunol [Internet]. 2021;11. Available from: https://www.frontiersin.org/articles/10.3389/fimmu.2020.604000/full.
|
| 38. |
Verthelyi D, Klinman DM. Sex hormone levels correlate with the activity of cytokine‐secreting cells in vivo. Immunology [Internet]. 2000;100(3):384–90. Available from: https://onlinelibrary.wiley.com/doi/10.1046/j.1365-2567.2000.00047.x.
|
| 39. |
Mauvais-Jarvis F, Clegg DJ, Hevener AL. The Role of Estrogens in Control of Energy Balance and Glucose Homeostasis. Endocr Rev [Internet]. 2013;34(3):309–38. Available from: https://academic.oup.com/edrv/article/34/3/309/2354631.
|
| 40. |
Jgarkava M, Pantsulaia I, Rukhadze R, Karanadze N, Chikovani T. Association of il-10 and resistin in apparently healthy elderly population. Georg Med News [Internet]. 2021;318:119–24. Available from: https://www.researchgate.net/profile/Tinatin-Chikovani/publication/355250290_ASSOCIATION_OF_IL-10_AND_RESISTIN_IN_APPARENTLY_HEALTHY_ELDERLY_POPULATION/links/61950c7507be5f31b78ec9cc/ASSOCIATION-OF-IL-10-AND-RESISTIN-IN-APPARENTLY-HEALTHY-ELDERLY-POPULATI.
|
| 41. |
Cuneo AA, Herrick D, Autieri M V. Il-19 reduces VSMC activation by regulation of mRNA regulatory factor HuR and reduction of mRNA stability. J Mol Cell Cardiol [Internet]. 2010;49(4):647–54. Available from: https://linkinghub.elsevier.com/retrieve/pii/S0022282810001793.
|
| 42. |
Ellison S, Gabunia K, Kelemen SE, England RN, Scalia R, Richards JM, et al. Attenuation of Experimental Atherosclerosis by Interleukin-19. Arterioscler Thromb Vasc Biol [Internet]. 2013;33(10):2316–24. Available from: https://www.ahajournals.org/doi/10.1161/ATVBAHA.113.301521.
|
| 43. |
England RN, Preston KJ, Scalia R, Autieri M V. Interleukin-19 decreases leukocyte-endothelial cell interactions by reduction in endothelial cell adhesion molecule mRNA stability. Am J Physiol Physiol [Internet]. 2013;305(3):C255–65. Available from: https://journals.physiology.org/doi/10.1152/ajpcell.00069.2013.
|
| 44. |
Ouyang W, O’Garra A. IL-10 Family Cytokines IL-10 and IL-22: from Basic Science to Clinical Translation. Immunity [Internet]. 2019;50(4):871–91. Available from: https://linkinghub.elsevier.com/retrieve/pii/S1074761319301372.
|
| 45. |
Sabat R, Wolk K. Deciphering the role of interleukin-22 in metabolic alterations. Cell Biosci [Internet]. 2015;5(1):68. Available from: http://www.cellandbioscience.com/content/5/1/68.
|
| 46. |
Herder C, Kannenberg JM, Carstensen-Kirberg M, Huth C, Meisinger C, Koenig W, et al. Serum levels of interleukin-22, cardiometabolic risk factors and incident type 2 diabetes: KORA F4/FF4 study. Cardiovasc Diabetol [Internet]. 2017;16(1):17. Available from: http://cardiab.biomedcentral.com/articles/10.1186/s12933-017-0498-6.
|
| 47. |
Keir ME, Yi T, Lu TT, Ghilardi N. The role of IL-22 in intestinal health and disease. J Exp Med [Internet]. 2020;217(3). Available from: https://rupress.org/jem/article/217/3/e20192195/133771/The-role-of-IL-22-in-intestinal-health-and.
|
| 48. |
Sabat R, Ouyang W, Wolk K. Therapeutic opportunities of the IL-22–IL-22R1 system. Nat Rev Drug Discov [Internet]. 2014;13(1):21–38. Available from: https://www.nature.com/articles/nrd4176.
|
| 49. |
Fabbrini E, Cella M, Mccartney SA, Fuchs A, Abumrad NA, Pietka TA, et al. Association Between Specific Adipose Tissue CD4+ T-Cell Populations and Insulin Resistance in Obese Individuals. Gastroenterology [Internet]. 2013;145(2):366-374.e3. Available from: https://linkinghub.elsevier.com/retrieve/pii/S0016508513005118.
|
| 50. |
Dalmas E, Venteclef N, Caer C, Poitou C, Cremer I, Aron-Wisnewsky J, et al. T Cell–Derived IL-22 Amplifies IL-1β–Driven Inflammation in Human Adipose Tissue: Relevance to Obesity and Type 2 Diabetes. Diabetes [Internet]. 2014;63(6):1966–77. Available from: https://diabetesjournals.org/diabetes/article/63/6/1966/34320/T-Cell-Derived-IL-22-Amplifies-IL-1-Driven.
|
| 51. |
Abdalla MMI. Advancing diabetes management: Exploring pancreatic beta-cell restoration’s potential and challenges. World J Gastroenterol [Internet]. 2024;30(40):4339–53. Available from: https://www.wjgnet.com/1007-9327/full/v30/i40/4339.htm.
|
