

Istel HR 2000 in clinical practice: diagnostic accuracy versus standard ECG using aVR lead data


Abstract
Background: Mobile ECG devices are increasingly used in telecardiology, but the diagnostic utility of the Istel HR 2000 ECG recorder has not been fully established beyond AF detection. This study evaluated the accuracy and comparability of Istel recordings versus standard limb 6-lead ECG, with particular emphasis on the QRS vector in aVR lead.
Material and methods: We compared standard ECGs of 59 adults with their Istel ECGs (recorded in up to 3 positions). The aVR vector was calculated by adding R and S/Q wave amplitudes. The correlations between aVR vectors were evaluated. Istel recordings with an aVR vector ≤ -1 mm in all positions were included for further comparative analysis of ECGs parameters.
Results: The mean difference in aVR vector between standard and Istel ECGs was similar across all device positions. Based on the aVR criteria, 37 patients (62.7%) were eligible for further analysis. Istel recordings more frequently showed right axis deviation and T-wave abnormalities than standard ECG. Device position influenced ECG interpretation, with position 3 showing the highest concordance.
Conclusions: Istel HR 2000 provides reproducible ECG recordings but cannot replace the standard limb ECG. Device position and altered lead geometry affect ECG interpretation. The aVR vector may help assess recording validity, although further studies are required.
Citation
Firkowska A, Stepnowska J, Śron K, Młyński M, Bavnbek A, Kroczak K, Gonzalez M, Spychalski P. Istel HR 2000 in clinical practice: diagnostic accuracy versus standard ECG using aVR lead data. Eur J Transl Clin Med.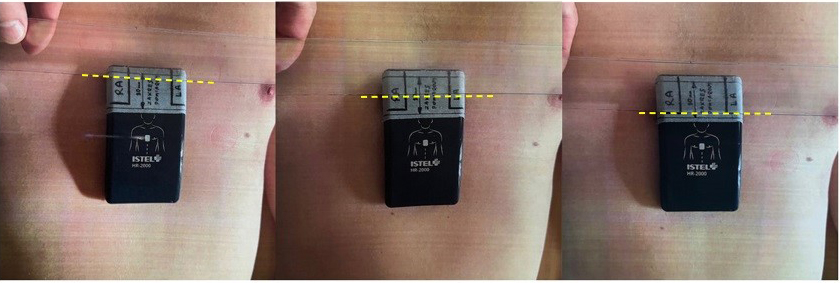


Introduction
Nowadays, the use of telemonitoring in medicine is increasingly widespread, particularly in cardiology. Electrocardiographic telemonitoring (TM-ECG) using external recording devices is a fundamental tool of cardiological telediagnostics. This method is based on the remote acquisition and transmission of electrocardiographic (ECG) recordings. TM-ECG enables the detection, documentation, and evaluation of abnormalities in cardiac electrical activity during patients’ everyday activities, thereby increasing the likelihood of establishing an accurate diagnosis. Although it is not the most efficient, the most commonly used device for the initial screening of arrhythmias is the Holter ECG monitor [1]. Its most important limitation is the fact that it does not provide real-time ECG, thus delaying the diagnosis [2]. Recent advances in long-term ambulatory ECG recording can be a solution. We can distinguish devices that are handheld (e.g. KardiaMobile, KM) or attached to the chest, wearable (e.g. Holter recorders, smartwatches or the Cardiovest system) as well as implantable loop recorders and mobile recorders (based on ECG or photoplethysmography) [3-5].
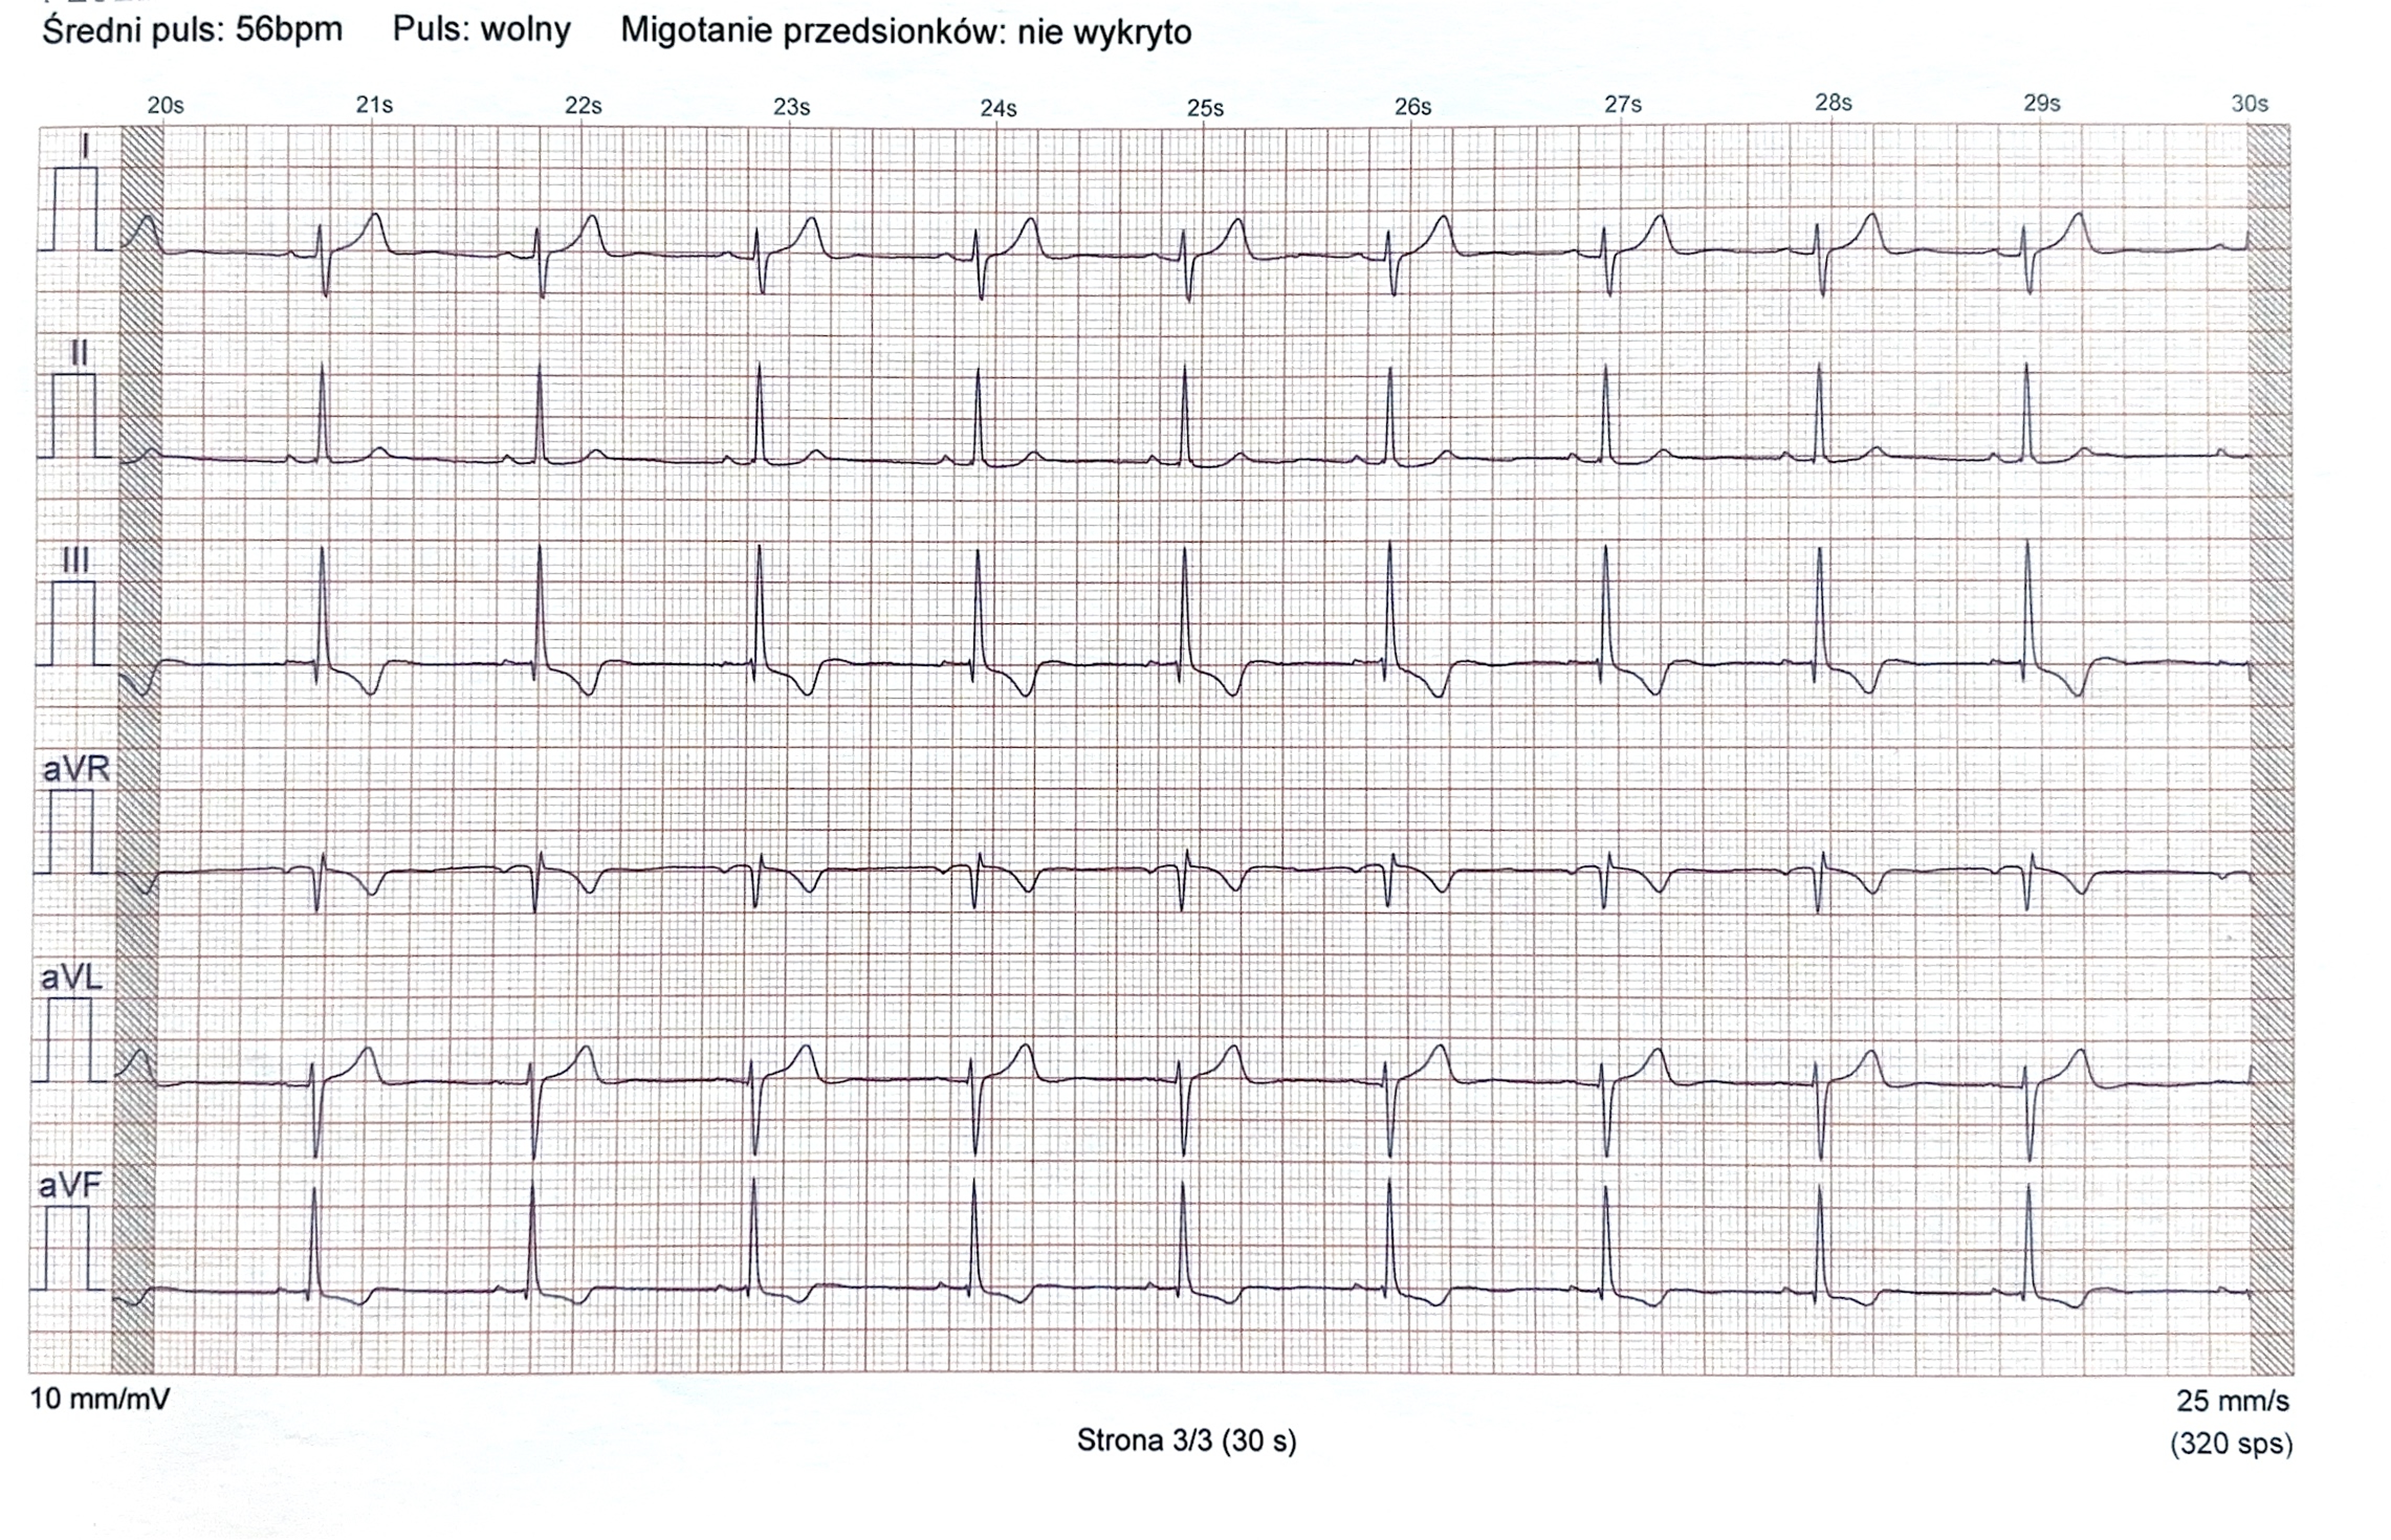
To emphasize the importance and usefulness of the topic, the authors of an European Heart Rhythm Association document indicated that both photoplethysmography and ECG- -based mobile health devices can be used as screening tools for atrial fibrillation (AF) and also can be used to diagnose arrhythmias [6]. The example of a mobile electrocardiogram (ECG) recorder is the Istel 2000, produced in Poland (IS). Its purpose is to assess the heart rate and to detect AF (Figure 1).
Figure 1. Example of an ECG tracing recorded by the Istel HR 2000 device
Średni puls – average pulse; puls: wolny – pulse: slow; Migotanie przedsionków: nie wykryto – atrial fibrillation: not detected; strona – page
It contains 4 integrated electrodes, which provide a wireless 6-lead (I, II, III, aVL, aVR, aVF) ECG recording. The IS device is easy to use (ECG is obtained by placing the IS in the middle of a bare chest and holding it for 30 seconds) and can be performed by patients outside medical facilities. The ECG recordings can be uploaded from the IS to a dedicated smartphone app (Android or iOS). The aim of this study was to estimate the diagnostic accuracy of the IS ECG recordings based on the device’s placement on the chest and aVR lead deflection. By comparing the IS ECG recordings to standard 6-lead limb lead ECGs (SE), we intended to observe whether IS allows a reliable assessment of ECG parameters, (beyond the presence of AF and heart rate changes) and can be used to support therapeutic decisions. As a point of reference we choose the aVR lead deflection.
Materials and methods
The study population included a total of 59 adult patients (16 women and 43 men) and their median age was 38 (21-75) years. The median age for women was 40.5 (21-65) years and for men was 36 (21-75) years. All the participants were patients of a cardiology outpatient clinic and were in the diagnostic process of heart palpitations. At the time of the study, the participants were not diagnosed with any specific cardiovascular diseases. Between 20th March 2021 and 2nd October 2022 during their scheduled appointments at the clinic, we used an Aspel AsCARD Grey v.07.205 ECG device (Aspel SA, Zabierzów, Poland) to obtain SE from each participant. During the same visit, we recorded an ECG using the Istel HR 2000 (Diagnosis S.A., Białystok, Poland) from each participant.
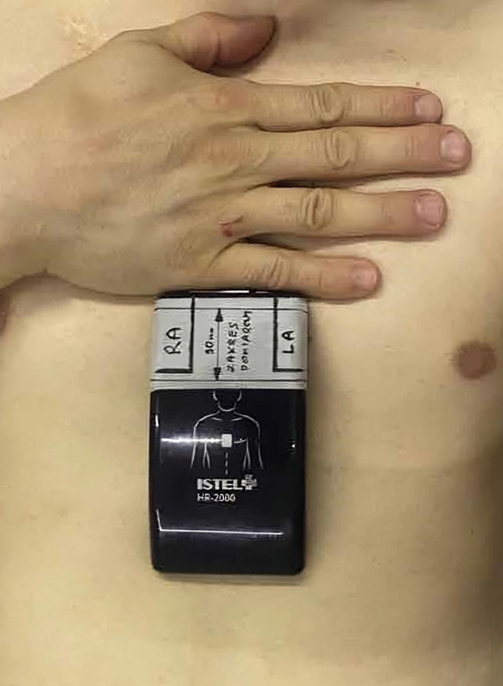
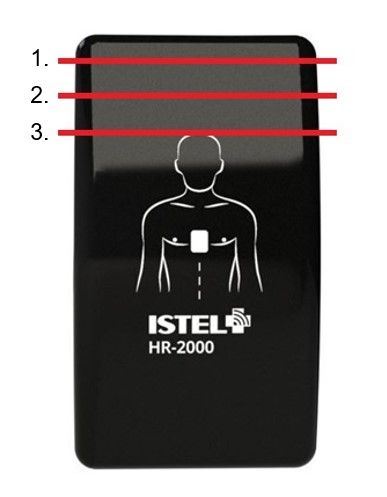
On the 30 mm long superior part of the IS device there was a designated measuring area. In that area we distinguished 3 sectors serving as the indicators of the IS position on the patient’s chest (Figure 2). The initial positioning of the device was achieved by placing the palmar surface of the patient’s right hand on the chest and setting the patient’s thumb in the jugular notch of the sternum (position 1) (Figure 3). The IS was then located in the middle of the chest by putting its superior margin parallel to the edge of the 5th finger. To obtain further positions we shifted the device 10 mm superiorly (position 2) and then another 10 mm superiorly (position 3). In each of the 3 positions the IS device was aligned with the horizontal nipple line (Figure 4).
Figure 2. Istel HR 2000 placement indicators
Figure 3. Initial position of the device
Figure 4. Istel HR 2000 in 3 positions on patient’s chest; from right: position 1, position 2, position 3
All ECGs were obtained at rest under standardized conditions. Patients were placed in supine position on the examination bed. During IS assessment, we focused primarily on the evaluation of the aVR lead QRS complex deflection as a method for selecting patients with ECG-recordings that were most comparable to SE. In each IS recording we calculated the net vector of the QRS complex by adding the amplitudes of the R wave with S and/or Q wave. IS ECGs with aVR vector ≤ -0.1mV in each device position were included in further analysis of ECG parameters. The ECGs which did not meet the criteria were out of analysis in order to eliminate the possibility of human mistake and achieve more reliable results. All IS ECGs were assessed in terms of the changes of aVR vector depending on measurement position. The IS ECGs meeting the above criteria were analyzed in accordance with the Polish ECG guidelines and focused on the presence of sinus rhythm (SR), electrical heart axis, changes in ST-segments and T waves [7].
Results
Standard ECG (SE)
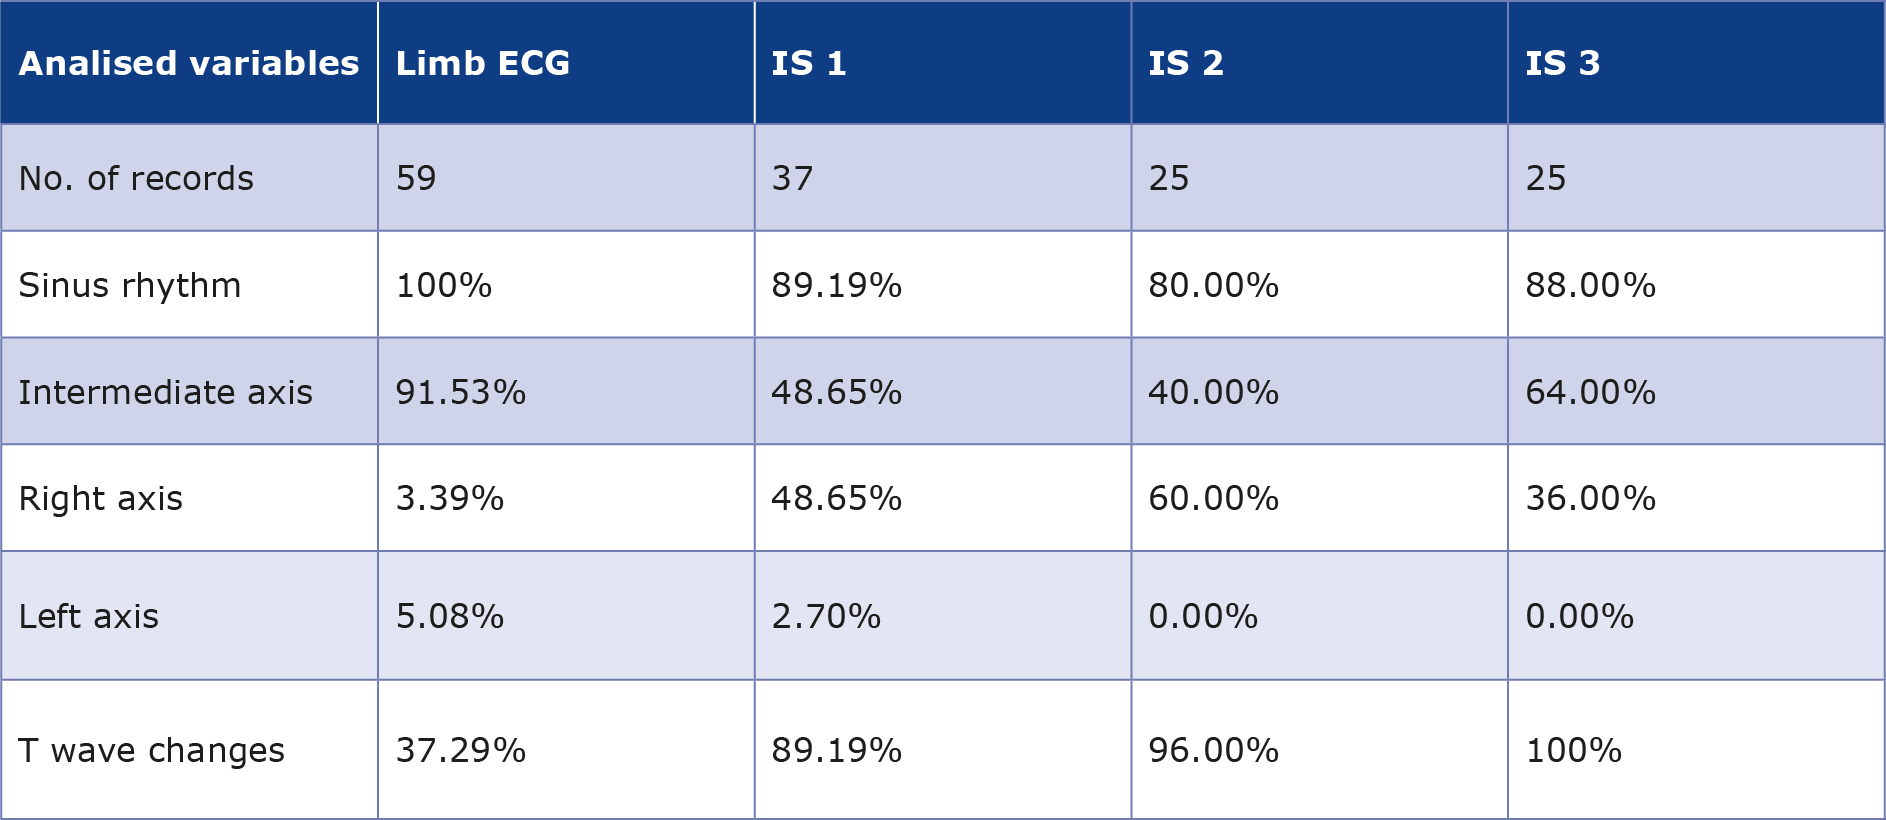
A total of 59 SE were obtained and all were good quality (clear isoelectric line, no artifacts, well-defined waves). Sinus rhythm was present in all of the SEs obtained from the participants. Intermediate axis was seen in 54 out of 59 participants (91.53%), 3 had left axis deviation (5.08%) and 2 had right axis deviation (3.39%). In 37.29% of the ECGs there were T wave alterations such as: negative T wave in III lead (n = 18); negative T wave in aVL lead (n = 2) and negative-positive T wave in III lead (n = 2). None of the patients had significant ST segment changes. Among the 59 participants with SEs, 98.31% of them (n = 58) had a negative aVR vector (ranging from -0.15 mV to -1.05 mV). The patient with a positive aVR vector (+0,3 mV) had left axis deviation. No arrhythmias were found in the SE tracings.
Istel ECG (IS)
Overall, we recorded a total of 135 IS tracings in 59 patients. There were 18 participants with IS recordings made in 3 positions. 40 participants had IS recorded in 2 positions (21 in positions 1 & 3, 19 in positions 1 & 2) and 1 participant in only 1 position. There were 38 patients with negative aVR vectors in each IS position. Among them there was 1 person with an aVR vector > -0,1mV in at least one position. Based on the aVR lead vector and the criteria mentioned in the “Material and methods” section, among all 59 participants 37 people were included in further analysis (62.71%). In these 37 patients we assessed their IS recordings (n = 87) and compared them to SE. 22 people were not included into further analysis. There was no arrhythmia found in any IS ECGs.
AVR vector
Taking the IS recordings into assessment, in 15 participants we observed a smaller (more negative) aVR vector in position 1 than in position 2. The difference in deflection ranged from 0.5 mm to 3 mm. 22 participants had an aVR vector either greater or equal in position 1 than in position 2 (9 had greater, 13 equal). 39 participants had IS recorded in positions number 1 & 3. In 11 participants we noted an aVR vector smaller in position 1 rather than in position 3. 28 participants had an aVR vector greater or equal in position 1 than in position 3 (14 equal, 14 greater). There were 18 measurements made between aVR vector on IS ECG in position 2 and in position 3. 27.78% (n = 5) of these patients had aVR deflection smaller in position 2. The remaining 13 measurements had aVR vector equal in both positions in 61.11% (11 out of 18) cases and greater in position 2 in 11.11% (2 out of 18).
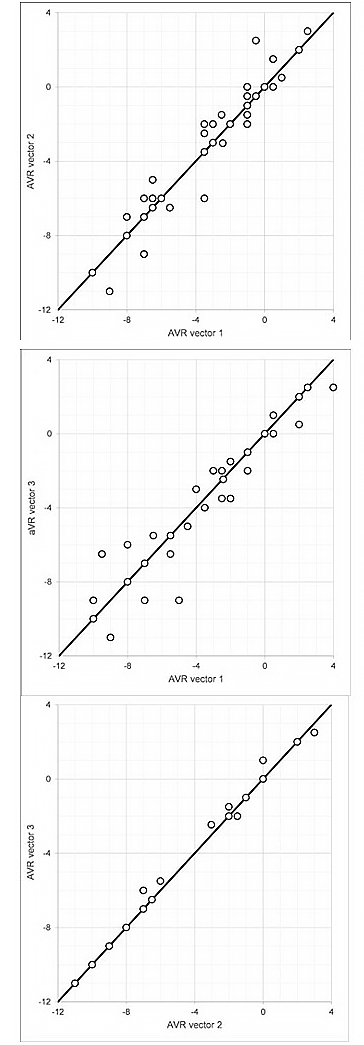
Correlations between the aVR vectors in different IS positions are shown in Figure 5. The black line depicts the situation where vectors in both positions are equal. For example: in the graph showing vectors in position 1 and 2, points under the line show results where the aVR vector in position 1 is greater than in position 2, and points over the line depict results where the aVR vector is smaller in position 1 than in position 2. It was also observed that the mean difference between the aVR vector in the IS ECGs compared to the aVR vector on the SE was similar across IS positions 1, 2 and 3: 0.351 mV, 0.326 mV, and 0.344 mV respectively.
Figure 5. Comparison of aVR vectors in different Istel positions
Heart axis
Taking position number 1 into assessment, there were 37 measurements. Nearly half of the group (48.65%, n = 18) had right axis deviation. The intermediate axis was noted as well at 48.65% (n = 18). Left axis deviation was observed in only 1 patient. In the IS position number 2, there were 25 recordings taken into account. The intermediate heart axis was present in 40% (n = 10) of records. In 60% (n = 15) of participants there was noted right axis deviation. 25 IS recorded in the 3rd IS position were taken into account. There were 64% (n = 16) of people with intermediate heart axis and 36% (n = 9) with right axis deviation.
Heart rhythm
In position 1 SR was not found in 10.81% (n = 4) of recorded IS. This results in 89.19% (n = 33) of patients with detected SR. In position 2 the criteria for SR were fulfilled in IS tracings of 80% (n = 20) of patients. In 88% (n = 22) of patients SR was detectable in position 3.
ST-T changes
In all IS positions, there were no significant ST segment changes observed.
In position 1, T wave changes were observed in 89.19% (n = 33). There were such changes as negative T wave in lead III (n = 15), negative T wave in lead aVF and III (n = 15) and other nonspecific changes in 3 patients.
In 2nd position, T wave changes were observed in 96% (n = 24) of participants. There was noted negative T wave in lead III and aVF (n = 14), negative T in lead III (n = 8), negative-positive T wave in lead III and aVF (n = 1) and negative-positive T wave in aVF lead with negative T in III (n = 1).
Finally, in 3rd position, T wave abnormalities were found in 100% patients. Negative T wave in lead III was observed in 32% (n = 8); negative T wave in leads III and aVF leads in 48% (n = 12); other changes were observed in 5 records.
The data are summarized in Table 1.
Table 1. Comparison of ECG parameters among 6-lead limb ECGs and chosen Istel HR 2000 recordings in 3 positions
Discussion
There are a few articles particularly taking up the topic of clinical use of the IS. Usually, the publications take into account the problem of AF and describe a variety of diagnostic devices and solutions. Bonini et al. focused on the types of mobile health solutions [8]. The authors described the role of photoplethysmography-based devices and ECG-based devices (KM, smartwatches) in detecting paroxysmal arrhythmias, although the IS device was not mentioned [8]. Książczyk et al. covered the topic of smartphone and smartwatch apps in arrhythmia detection [9]. Although they briefly described the IS device and its “device-dependent” app, no further analysis of IS ECG was conducted [9]. Krzowski et al. compared SE, IS and the KM device [10]. They observed that normal heart axis was less common in ECG tracings obtained from IS (18%) than from KM (61%) or SE (69%) [10]. Our data confirmed that IS recordings included an intermediate heart axis less often than limb ECG.
In our analysis, the aVR lead proved to be a useful parameter. Physiologically, the QRS complexes in the aVR are predominantly negative, as the mean cardiac electrical vector is oriented away from the right arm electrode. Positive or atypical deflections in aVR may indicate an underlying pathology, e.g. right atrial enlargement, right ventricular hypertrophy or extensive myocardial ischemia [11-12]. Nearly all of our participants had a negative aVR vector on SE. After applying our aVR-based criteria (see “Material and methods”) to IS recordings, approximately two-thirds of participants (n = 37) were eligible for further analysis of IS ECG parameters. This highlights aVR lead’s potential role as a screening tool for the validity of single-device ECG recordings.
Compared to ES, right axis deviation was observed more frequently in IS recordings, particularly in positions 1 and 2. These findings likely reflect the altered lead geometry inherent to the IS device rather than true pathological axis deviation. In SE the electrodes are located on the limbs and create the Einthoven triangle with the heart in the middle of it. IS lacks this classic orientation, as the IS device electrodes are much closer to each other and the heart (source of the electrical signal) is not located at the geometric center of the measurement system. The lead axes and angles are altered and the distribution of the heart’s electrical potentials changes. Position 3 yielded a higher proportion of intermediate axis recordings, suggesting that this placement may more closely approximate SE lead placement and therefore provide more physiological results.
Sinus rhythm identification was generally possible in IS recordings, although in a small subset (n = 12) of these recordings sinus rhythm could not be confidently identified (most notably in position 2). This limitation is likely related to the reduced P-wave amplitude or suboptimal lead alignment, indicating that device position may limit the reliability of rhythm analysis in single- or limited-lead EKG devices such as IS.
Repolarization abnormalities, particularly T-wave changes, were markedly more frequent in IS recordings than in ES. Negative T waves in leads III and aVF were noted across all device positions, with the majority in position 3. Importantly, these T-wave changes were not accompanied by ST-segment deviations, suggesting that they are most likely attributable to differences in lead orientation and vector projection. This finding highlights the need for caution when interpreting T-wave morphology in non-standard ECG lead placement.
Conclusions
This study evaluated electrocardiographic parameters obtained from standard limb ECG and IS recordings performed in different device positions, with particular emphasis on aVR vector changes. Our findings demonstrate that while standard ECG results were largely normal across the study population, IS recordings showed some differences that must be considered in clinical interpretation. At this moment, it cannot be said that IS recorder can be a substitute for standard ECG. Future studies should focus on optimizing the device position, correlating findings in IS recordings with 6-lead ECGs in diverse patient populations and defining position-specific reference values to improve diagnostic accuracy.
Funding
None.
Conflicts of interest
None to report.
References
| 1. |
Shen Q, Li J, Cui C, Wang X, Gao H, Liu C, et al. A wearable real-time telemonitoring electrocardiogram device compared with traditional Holter monitoring. J Biomed Res [Internet]. 2021;35(3):238. Available from: http://www.jbr-pub.org.cn/article/doi/10.7555/JBR.34.20200074?viewType=HTML.
|
| 2. |
Kędzierski K, Radziejewska J, Sławuta A, Wawrzyńska M, Arkowski J. Telemedicine in Cardiology: Modern Technologies to Improve Cardiovascular Patients’ Outcomes — A Narrative Review. Medicina (B Aires) [Internet]. 2022;58(2):210. Available from: https://www.mdpi.com/1648-9144/58/2/210.
|
| 3. |
Suchecka J, Homenda W, Kukulski S, Młyński M, Kozłowski D. A novel method for the diagnosis and monitoring of cardiac arrhythmias in patients with chronic lymphocytic leukemia treated with ibrutinib. Polish Arch Intern Med [Internet]. 2025;135(7–8). Available from: https://www.mp.pl/paim/issue/article/17060.
|
| 4. |
Dahiya ES, Kalra AM, Lowe A, Anand G. Wearable Technology for Monitoring Electrocardiograms (ECGs) in Adults: A Scoping Review. Sensors [Internet]. 2024 ;24(4):1318. Available from: https://www.mdpi.com/1424-8220/24/4/1318.
|
| 5. |
Suchecka J, Świątczak M, Młyński M, Daniłowicz-Szymanowicz L, Kozłowski D. Electrocardiogram recording vest: A useful tool in explaining recurrent syncope. Cardiol J [Internet]. 2024;31(1):168–70. Available from: https://journals.viamedica.pl/cardiology_journal/article/view/87231.
|
| 6. |
Svennberg E, Tjong F, Goette A, Akoum N, Di Biase L, Bordachar P, et al. How to use digital devices to detect and manage arrhythmias: an EHRA practical guide. Europace [Internet]. 2022;24(6):979–1005. Available from: https://academic.oup.com/europace/article/24/6/979/6561927.
|
| 7. |
Baranowski R, Wojciechowski D, Kozłowski D, Kukla P, Kurpesa M, Lelakowski J, et al. Compendium for performing and describing the resting electrocardiogram. Diagnostic criteria describe rhythm, electrical axis of the heart, QRS voltage, automaticity and conduction disorders. Experts’ group statement of the Working Group on Noninvasive Ele. Polish Hear J (Kardiologia Pol [Internet]. 2016;74(5):493–500. Available from: https://doi.org/10.5603/KP.2016.0070.
|
| 8. |
Bonini N, Vitolo M, Imberti JF, Proietti M, Romiti GF, Boriani G, et al. Mobile health technology in atrial fibrillation. Expert Rev Med Devices [Internet]. 2022;19(4):327–40. Available from: https://www.tandfonline.com/doi/full/10.1080/17434440.2022.2070005.
|
| 9. |
Książczyk M, Dębska-Kozłowska A, Warchoł I, Lubiński A. Enhancing Healthcare Access–Smartphone Apps in Arrhythmia Screening: Viewpoint. JMIR mHealth uHealth [Internet]. 2021;9(8):e23425. Available from: https://mhealth.jmir.org/2021/8/e23425.
|
| 10. |
Krzowski B, Skoczylas K, Osak G, Żurawska N, Peller M, Kołtowski Ł, et al. Kardia Mobile and ISTEL HR applicability in clinical practice: a comparison of Kardia Mobile, ISTEL HR, and standard 12-lead electrocardiogram records in 98 consecutive patients of a tertiary cardiovascular care centre. Eur Hear J - Digit Heal [Internet]. 2021;2(3):467–76. Available from: https://academic.oup.com/ehjdh/article/2/3/467/6274659.
|
| 11. |
Riera ARP, Ferreira C, Ferreira Filho C, Dubner S, Barbosa Barros R, Femenía F, et al. Clinical Value of Lead aVR. Ann Noninvasive Electrocardiol [Internet]. 2011;16(3):295–302. Available from: https://onlinelibrary.wiley.com/doi/10.1111/j.1542-474X.2011.00435.x.
|
| 12. |
Kozłowski D. Method in the Chaos – a step-by-step approach to ECG Interpretation. Eur J Transl Clin Med [Internet]. 2018;1(1):76–92. Available from: https://ejtcm.gumed.edu.pl/articles/8.
|
