
Breath-holding index – a new approach to an old method


Abstract
Background: Despite technical challenges and uncertainties, transcranial Doppler (TCD) ultrasonography remains a promising tool due to its non-invasive nature, safety, and cost-effectiveness. In this study we aimed to develop an advanced automatic calculation method for the breath-holding index (BHI) to enhance the reliability of cerebrovascular reactivity (CVR) measurements. Material and methods: This study involved the automatic calculation of BHI during the breath-holding maneuver, targeting a reduction in variability and an increase in the accuracy of CVR assessment. Results: The BHI_to_max method was identified as the most effective, which revealed the least variability. This method calculates the steepest slope of blood flow velocity change during CO2-induced vasodilation. By focusing on a minimized time interval and adjusting for potential shifts in the start and end points, this approach captures the most dynamic phase of the cerebrovascular response to CO2 . Conclusions: We propose an automatic calculation method, which accounts for individual differences in CO2 sensitivity and CVR. It offers a potentially more precise and personalized assessment of CVR, leading to a more reproducible and individualized measurement.
Citation
Nowakowska-Kotas M, Lisiak W, Wiśniewska E, Budrewicz S, Wiśniewski P. Breath-holding index – a new approach to an old method. Eur J Transl Clin Med. 2025;8(1):10-18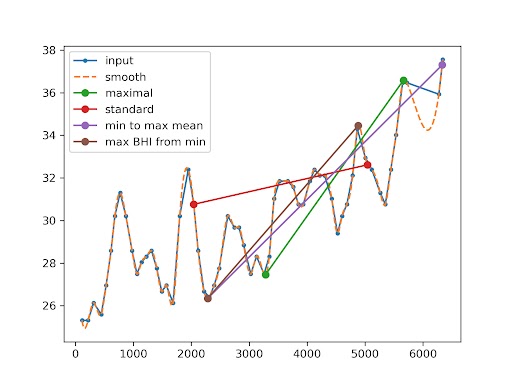


Introduction
The human brain requires stable perfusion of its tissues, which is maintained by regulating cerebral blood flow (CBF). Control of the CBF relies on mechanisms such as the myogenic response and changes in vessel diameter in response to vasoactive stimuli, collectively known as cerebrovascular reactivity (CVR). Measurement of CVR can provide information about the vessels’ condition and the brain’s ability to maintain required perfusion parameters [1-3]. Routinely employed tests of CVR are based on the change of the blood’s carbon dioxide (CO2 ) concentration. Hypocapnia, induced by hyperventilation during deep breathing tests, results in decreased mean velocities (Vmean) in the arteries of the brain, while increased CO2 concentrations lead to maximal flow, as demonstrated by several tests: breath-holding index (BHI), acetazolamide infusion, carbogen inhalation, or closed-circuit breathing [4-7]. It is assumed that in all those tests change in blood flow velocity (BFV) change reflects the changes in CBF. During the breath-holding test, CO2 concentration in the blood is transiently increased, resulting in a decrease of the resistance of cortical arterioles and increased velocity in main arteries of the brain. Those secondary alternations to a vasodilatory stimulus can be monitored in the middle cerebral artery (MCA) by transcranial Doppler (TCD) ultrasonography [8].
However, several technical problems arise during the breath-holding test, causing the variability of the BHI [8]. Among them, the conflicting correlations between BHI and inspired CO2 (ranging from weak to moderate), the role of patient’s body position and the influence of blood pressure are listed [9-14]. The sex and age differences, obesity, anxiety or difficulties with proper breath-holding, which were reasons for exclusion of some patients are discussed in the literature [12, 15-18]. The repeatability of the BHI test is also concerning, since standard deviation can vary from subject to subject from 0.15 up to 0.61 or the intraclass correlation coefficient for two consecutive measurements in one subject reaching 0.91 for CVR examinations in other study [16, 19].
The above-mentioned technical problems led to the search for a method of processing the data acquired via TCD acquired data in a way that would have the highest repeatability from one examination to the next, so as to reflect the CVR as accurately as possible. One example is the Breath-hold acceleration index, which is based on the linear regression of the most linear portion of the flow velocity change [20]. Different approaches would involve the automatic search for such time-related combination of parameters so the least variances of the results would be observed.
In this study we aimed to improve the accuracy of the BHI test by identifying the most dependable automatic technique for analyzing changes in CBF velocities during the breath-holding procedure.
Material and methods
A cohort of 8 healthy white individuals (4 males and 4 females) 20-56 years of age and devoid of chronic illness (e.g. diabetes, cardiovascular or cerebrovascular diseases), underwent assessment in a seated posture. Exclusion criteria were: < 18 years of age, nicotine consumption 24 hours before before the examination, medication use (including headache-alleviating medications) within 24 hours, consumption of fluids (apart from water) within 2 hours, and inadequate insonation of the MCA through the temporal window. This study was approved by the Bioethics Committee at the Wroclaw Medical University and informed consent was taken from each participant.
TCD
Participants underwent continuous, noninvasive monitoring of the BFV in both of the MCAs successively with the use of Nicolet™ Sonara/tek™ Transcranial Doppler System (Natus Medical Inc., San Carlos, CA, USA) with a fixed 2 MHz probe. The mean flow velocity (MFV) at certain time points of the test was considered. A baseline measurement of the MFV in the MCA was taken while the participant breathed normally for 4 minutes. Participants were explicitly directed not to start their breath-holding with a Valsalva maneuver. Instead, they were asked to simply cease breathing after inhaleing and then hold their breath for up to 30 seconds or until they felt the need to breathe inhale again. A total of 35 recordings were collected, which were used for further calculations of BHI in 150 variants for each recording.
Data processing
BFV data were recorded and then exported for further analysis in Excel (Microsoft, Redmond, WA, USA). A customized program was written in the Python language (Python Software Fundation, Wilmington, Delaware, USA) to help with processing of the obtained velocity data at a sampling rate of 0.625 samples per second (1.6 Hz). During the experiment the beginning and the end of the breath-hold maneuver were marked in the data set, so the data for further calculations were acquired simultaneously with the data used for the traditional BHI calculations.
Data analysis
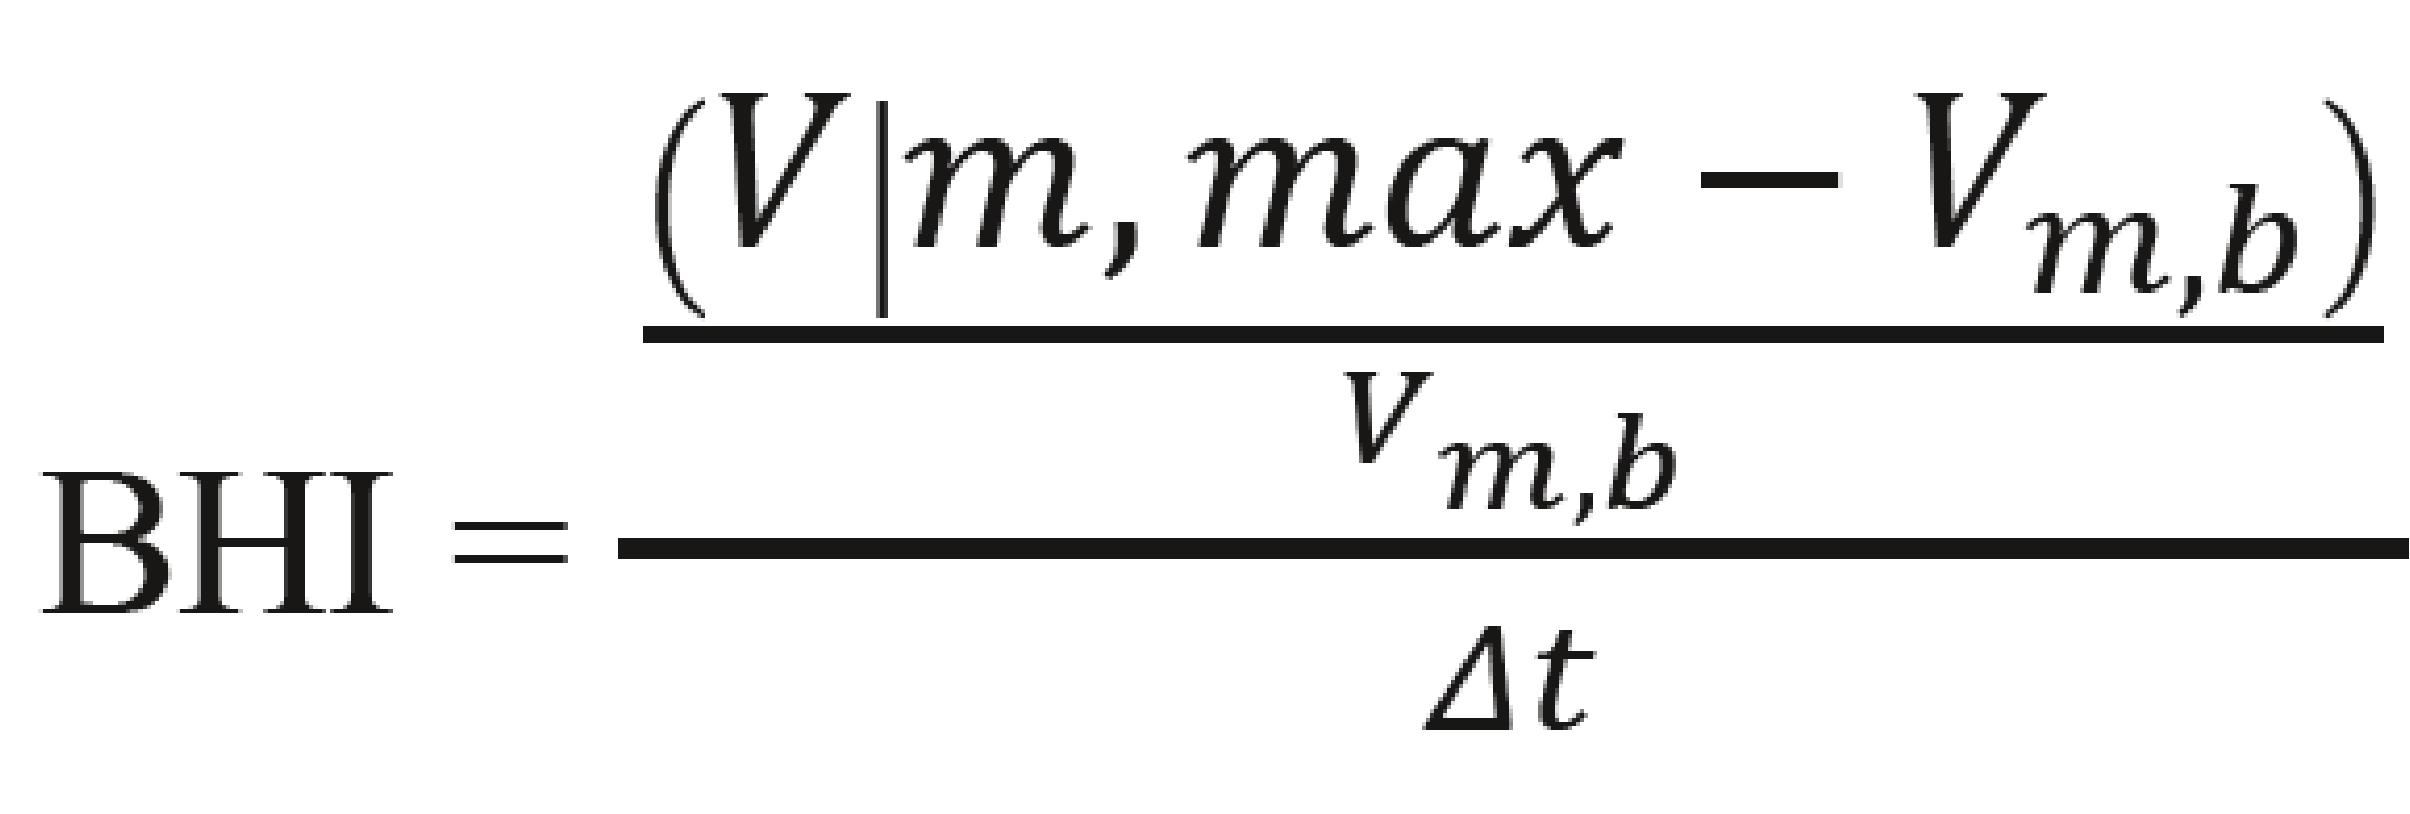
The alternative methods of calculating BHI were implemented in the program and compared to the original method ‘standard_BHI_value’, which is the standard method for calculating the average percentage increase in arterial BFV compared to its original value. The initial value was determined manually by the diagnostician as the moment the test began. The value of the standard approach was determined by the following formula:
, where:
- Vm, max – mean flow velocity at the end of the breath hold
- Vm, b – mean flow velocity at the baseline
- Δt – the duration of examination
The calculations of the alternative methods were as follows:
- ‘max_BHI_value’
This approach analyzes the graph of BFV over time. The test start time can be adjusted slightly by the diagnostician and the time interval with the steepest slope is selected. - ‘BHI_to_max’
The ‘BHI_at_maximal_mean_val’ is an inverse method to determine the maximum gradient of the graph’s slope. It first finds the highest mean BFV within the allowed time window, then pairs it with the lowest value in the permitted range. The interval with the steepest slope is chosen. - BHI_from_min’
The ‘maximal_BHI_from_minimal_mean_val’ method selects the steepest slope starting from the lowest initial BFV within the allowed time range and ending at the test’s specified endpoint.
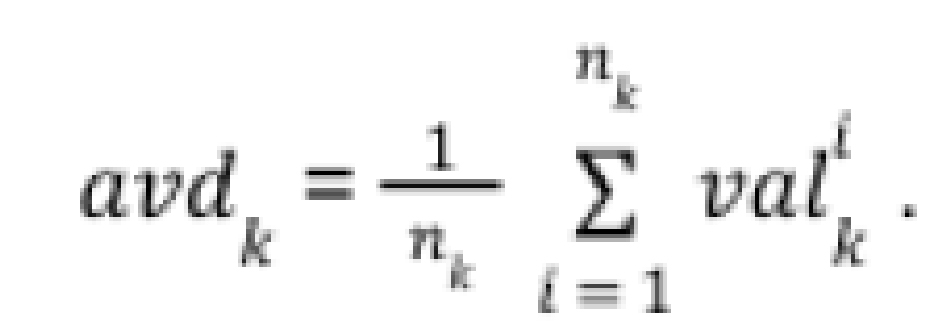
For each method, the pre-set parameters were defined, including the minimum duration of the analyzed test, how many seconds ahead of the start (in case the participant reacted earlier than the voice command), and how many seconds after the standard beginning and end of the test the algorithm should search for the highest BHI (Figure 1). The sets of these results were subsequently collected for each patient and averaged. Later, the variance was used as a measure of the fit of the results. The variance was normalized according to the average results of a given patient as in the formula below:
![]() , where:
, where:
- valk is the value of the measurement from each method relative to the patient’s measurements, for k being the key, represented as a list [‘standard_BHI’, ‘max_BHI’, ‘BHI_to_max’, ‘BHI_from_min’]
within a patient for each analysed set of 4 relevant parameters (minimum_time, advance, delay, extension), where:
- minimum_time – the earliest possible start of the exmination, determined by the diagnostician,
- advance – the time before minimum_time when the program can start calculations,- delay – the time between the actual end of the examination and its recorded endpoint,
- extension – the maximum time after the examination’s end within which calculations can expand (Figure 2-5).
Figure 1. Representative raw traces of the mean flow velocity (MFV) during the resting state and during the breath-holding test
The red line marks the start and end of the procedure). The visualization in different colors of proposed alternative methods of calculating BHI (detailed description in the text). Input – raw data. The smooth dashed line represents cubic interpolation.
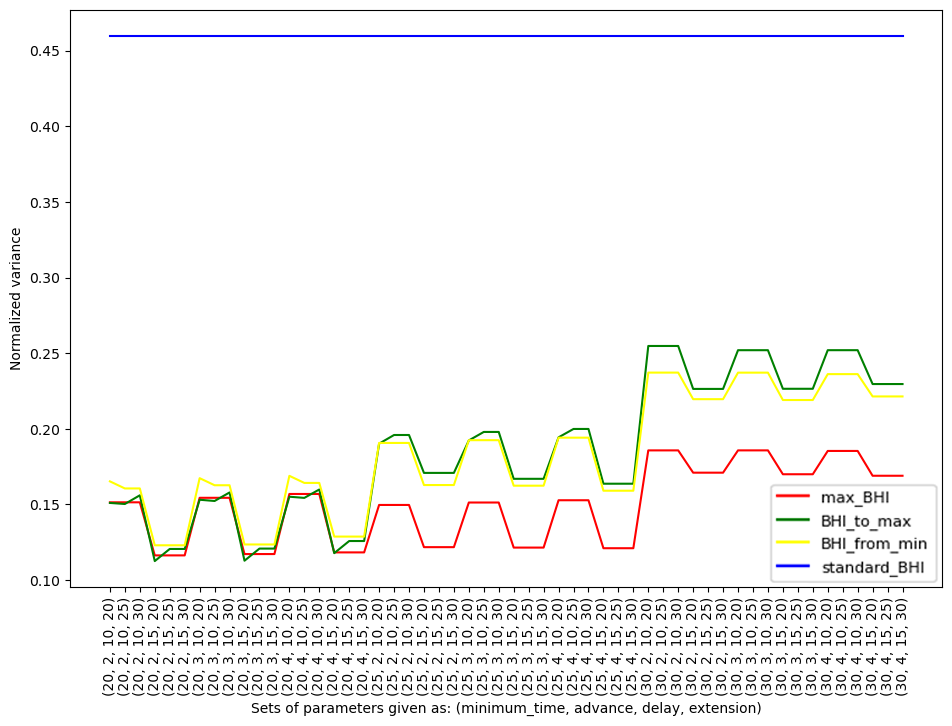
Figure 2. Normalized variance for each individual participant within specific methods (max_BHI, BHI_to_max, BHI_from_min, standard_BHI) against the parameters
The color of the graph corresponds to the methods described in the text.
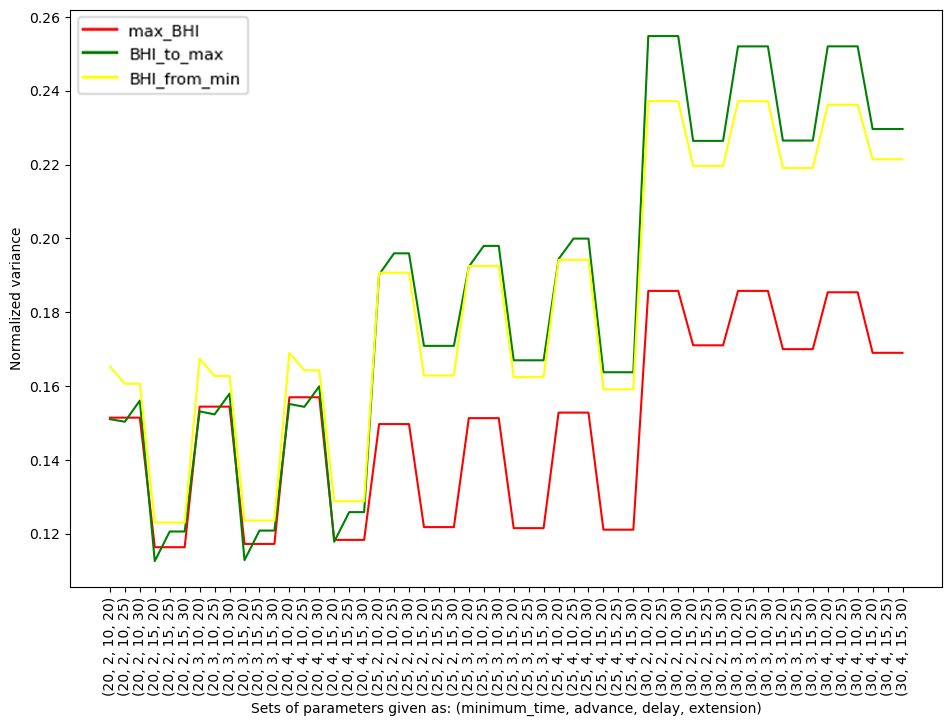
Figure 3. Normalized variance for each individual participant within specific methods (max_BHI, BHI_to_max, BHI_from_min) against the parameters
The color of the graph corresponds to the methods described in the text.
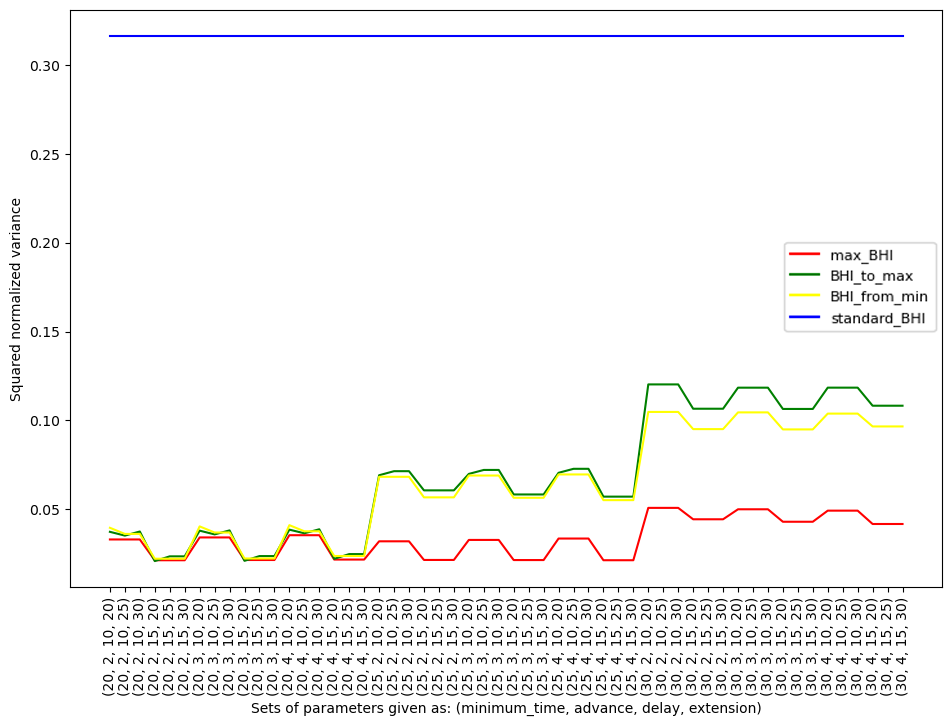
Figure 4. Squared normalized variance due to an individual participant together with specific methods (max_BHI, BHI_to_max, BHI_from_min, standard_BHI) and used parameters
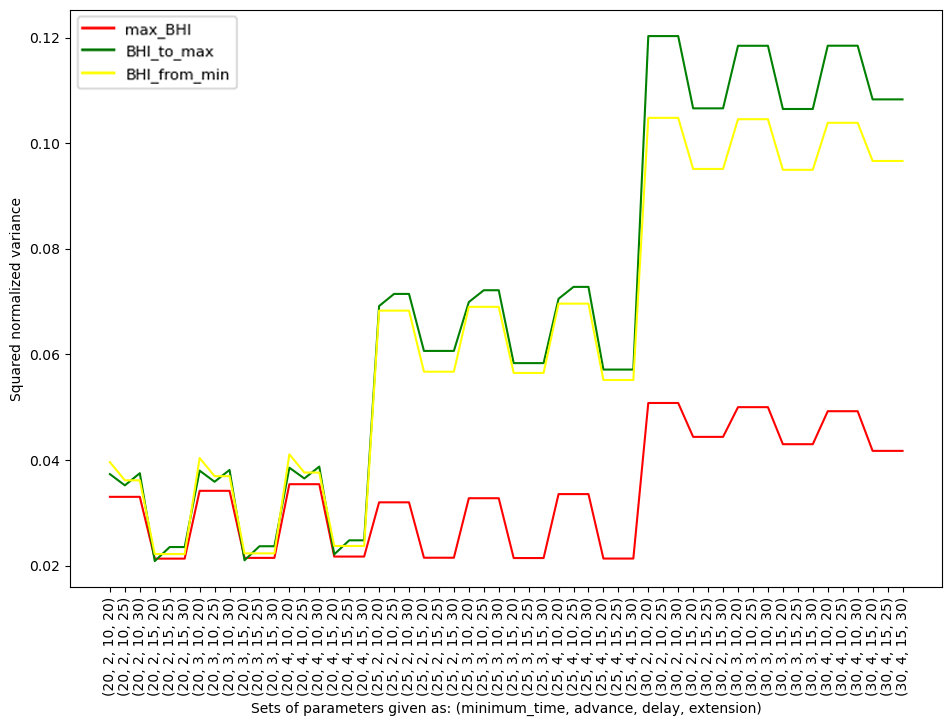
Figure 5. Squared normalized variance due to an individual participant together with specific methods (max_BHI, BHI_to_max, BHI_from_min) and used parameters
The ‘standard_BHI’ method was not included.
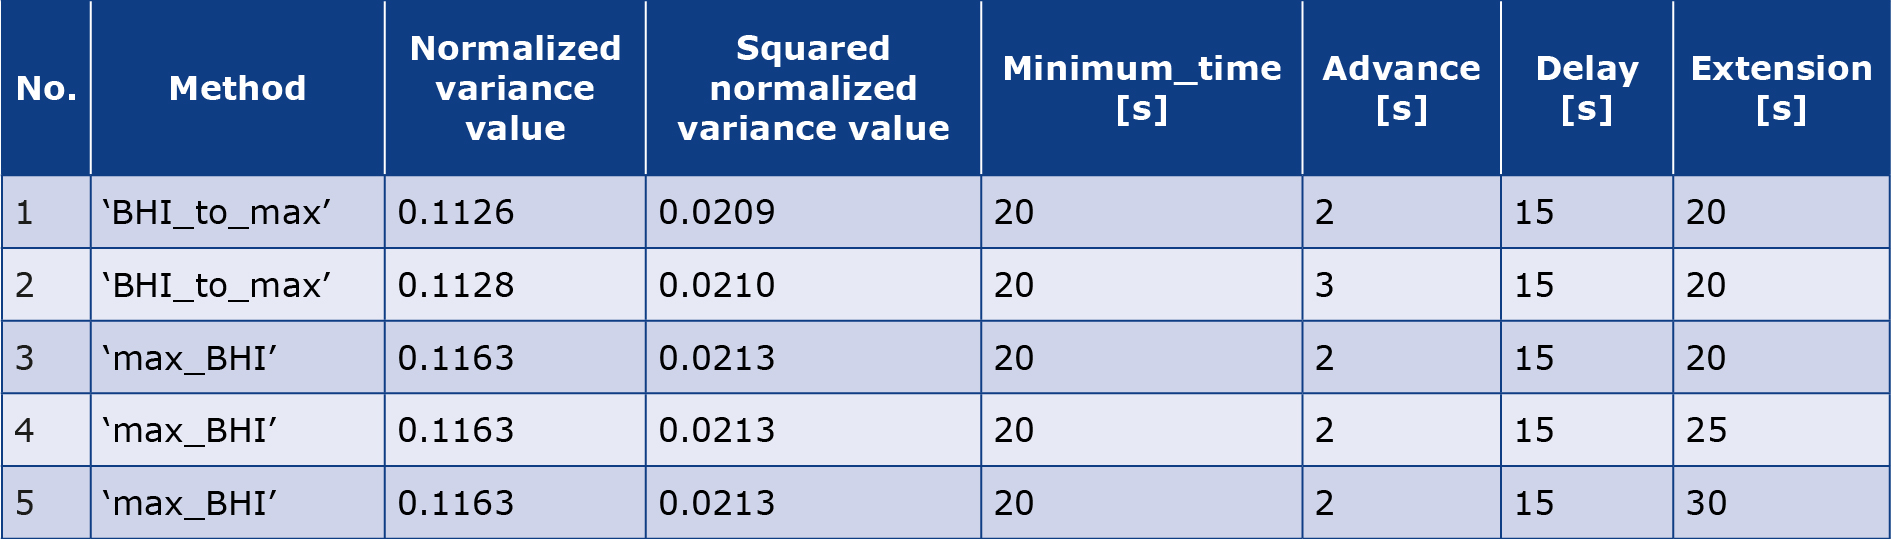
The five sets with the lowest normalized variance and lowest squared normalized variance are presented in graphs (Table 1).
Table 1. Five sets of parameters and the names of their methods for which the normalized variance is the smallest
Statistical analysis
The normality assumption of the data collected, resulting from their previous normalization, was confirmed using the Shapiro-Wilk statistical test. Levene’s test and Cohen’s Kappa were used to assess whether differences in variances across groups were statistically significant and to measure the consistency between two diagnostic methods. For all the statistical tests the level of significance was set to be α = 0.05 and compared to the p-values for each test.
Results
The best-performing sets of parameters for determining BHI were: Minimum_time = 20, Advance = 2, Delay = 15, Extension = 20, and Minimum_time = 20, Advance = 3, Delay = 15, Extension = 20. Values for each BHI calculation method for those parameters are shown in Figure 6 and Figure 7.
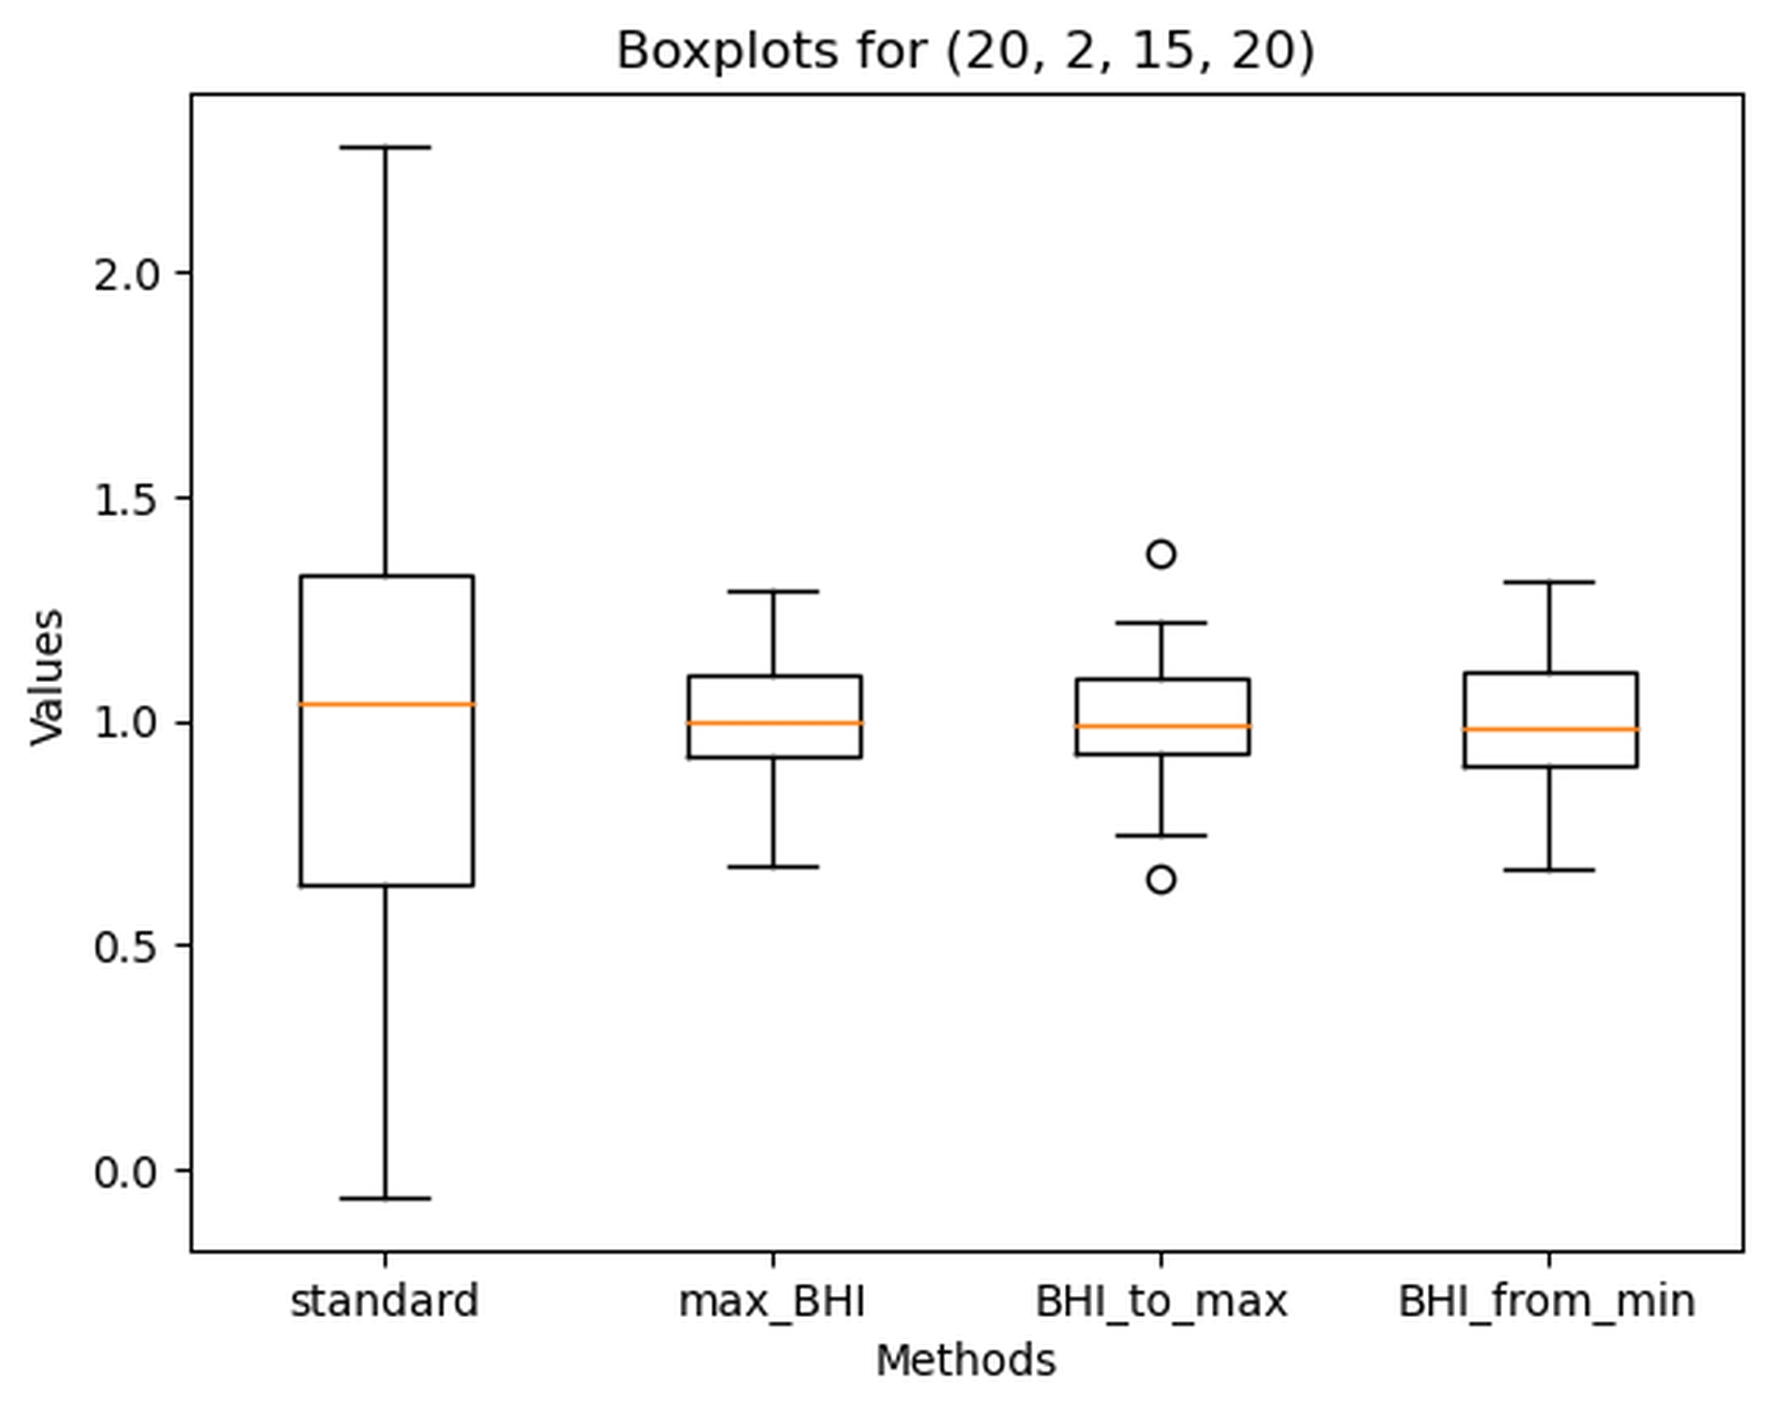
Figure 6. Boxplot of Breath holding index (BHI) calculated with different methods for the following parameters: Minimum_time = 20, Advance = 2, Delay = 15, Extension = 20
Standard – standard method, max_BHI – calculated according to the maximal BHI value approach, BHI_to_max calculated according to the ‘BHI_at_maximal_mean_val’ method and BHI_from_min calculated according to maximal_BHI_from_minimal_mean_val’ approach. Dots – outlier values
Figure 7. Boxplot of Breath holding index (BHI) calculated with different methods for the following parameters: Minimum_time = 20, Advance = 3, Delay = 15, Extension = 20
Standard – standard method, max_BHI – calculated according to the maximal BHI value approach, BHI_to_max calculated according to the ‘BHI_at_maximal_mean_val’ method and BHI_from_min calculated according to maximal_BHI_from_minimal_mean_val’ approach. Dots – outlier values
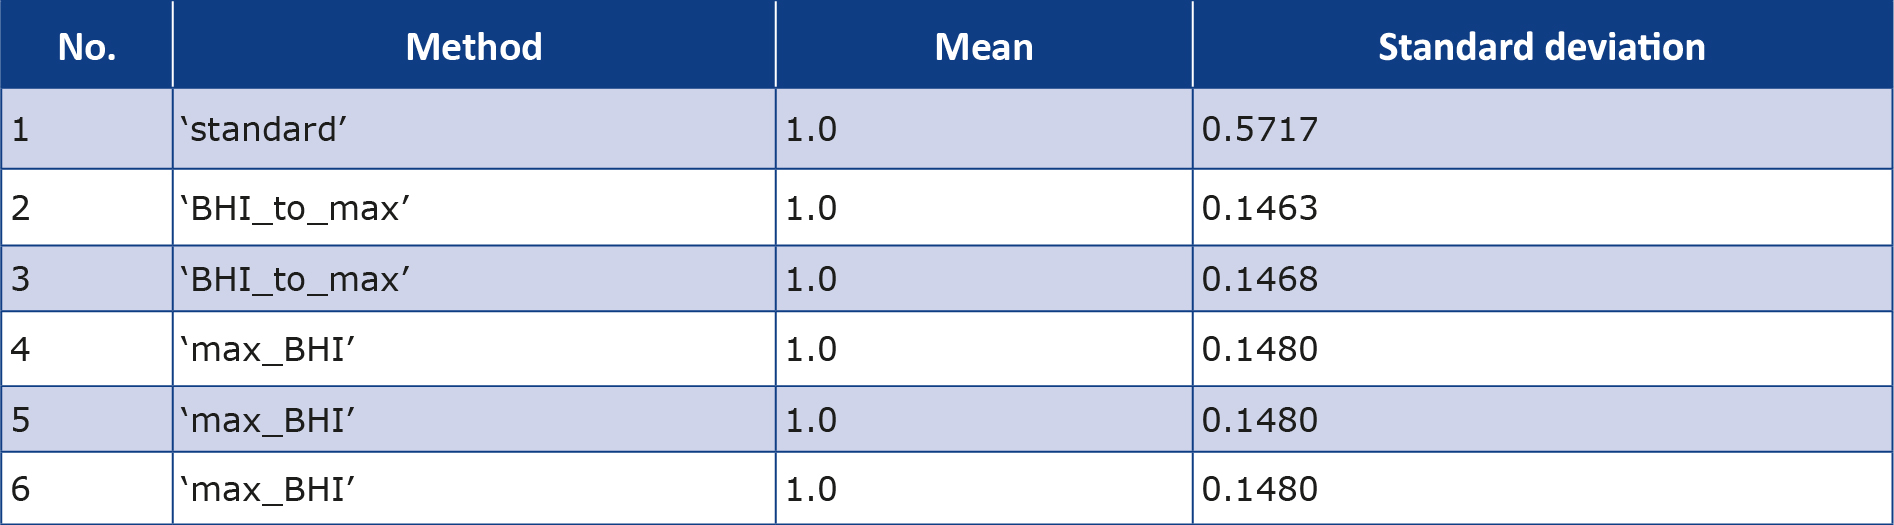
The results of the normalized variances for the standard_BHI were identical for each set of parameters, therefore in the rest of this article the term ‘standard_BHI’ refers to the standard method for the following parameters: Minimum_time = 20, Advance = 2, Delay = 15 and Extension = 20. Despite normalization of data, the SD of the standard_BHI remained extremely high, which can be seen in performance overview of all analyzed methods showing mean and standard deviations (SD) (Table 2).
Table 2. Methods of calculating BHI together with their mean values and standard deviations
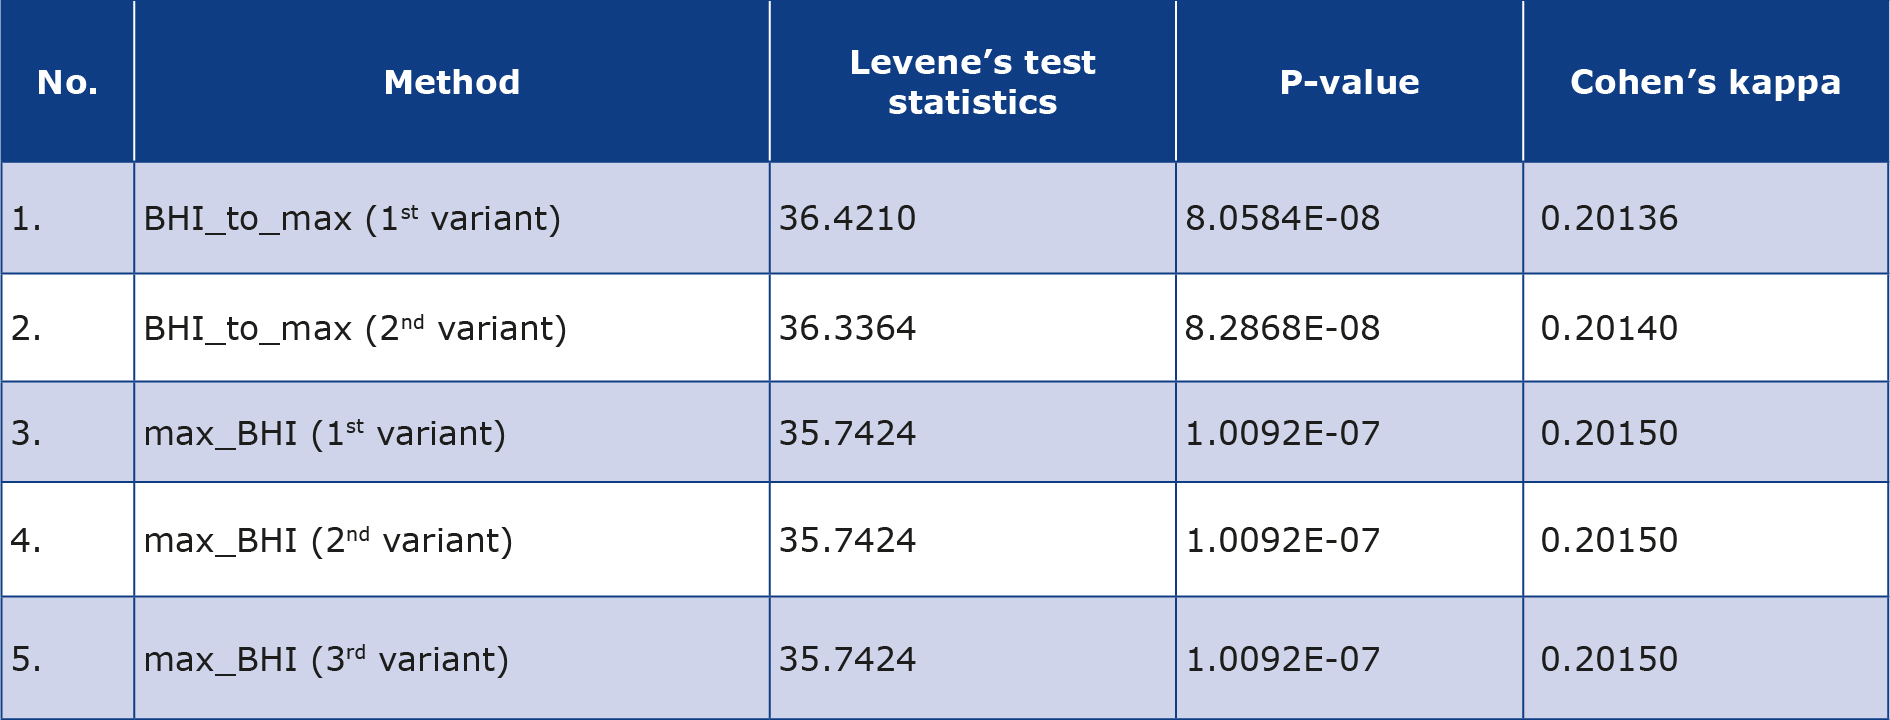
Levene’s test revealed a statistically significant difference between the variances, demonstrating that each of the alternative methods is more effective for calculating BHI than the standard method for each of the five best-performing sets of parameters and methods (Table 3). This also confirmed the conclusions based on the results of Table 1: the lower the p-value of Levene’s test, the better the alternative method performs in calculating the BHI. Subsequently, Cohen’s coefficients were calculated between the standard method and the alternative methods, which show the poor fit of each alternative method for calculating BHI relative to the standard method (Table 3).
Table 3. Comparison of five sets of parameters with lowest variance in comparison to standard method of BHI calculation using Levene’s test and values of Cohen’s kappa coefficient
Discussion
In this study, we introduced 3 innovative approaches to data analysis, improving the standard method of measuring the BHI index using a breath-hold manoeuvre. These methods have demonstrated statistically significant smaller participant-specific normalized variance values compared to the standard BHI (Table 1). The most robust model, BHI_to_max, focuses on identifying the greatest slope angle for the calculations, with parameters presets: minimum_time = 20, Advance = 2, Delay = 15 and Extension = 20. This model is calculated based on a minimal time interval of 20 sec (out of 30 s standard ones), while also considering the possible shift of the starting point in time of 2 sec, delay of the ending point of maximum 15 sec and the maximum extension of the exam up to 20 seconds counting from the end of the breath-holding test.
The method we present, which essentially captures the steepest slope, can reveal the most dynamic phase of the cerebrovascular response to CO2 , offering a more precise and individualized assessment of CVR. This is a significant advancement, considering the individual variability in the threshold for CO2 -induced changes in CBF [19]. By identifying the steepest portion of the response curve with this method, we may provide a more measure of reproducible measure of CVR, similar to the approach of Alwatban et al., but with the added benefit of automatic optimization of starting or ending points [20]. This approach aligns with the observed variability among individuals and potentially offers a more refined tool for assessing CVR in each individual.
The model tested the effect of prolongation of trial duration (using the parameter Extension) and found that reproducibility of the acquired parameters was negatively affected with prolongation of the minimum analyzed time period above 20 seconds – all models had a higher variance between individual trials performed by the same proband. However, this can be linked to the set initially test length being 30 s. On the other hand, the reduction in the required time, allowed the measurement to be optimized in those participants who, even perhaps unintentionally, shortened or lengthened the test period in a way that was unnoticeable to the investigator. Reducing the required time should not affect the biological value of the test, since it is postulated that the breath-hold length is not strongly correlated with changes in partial pressure of CO2 [21-22].
There is a lack of agreement on the protocols and methods for analyzing CVR. Some studies measured the peak MFV immediately, but not precisely describing how long, after the end of the period of breath-holding, while others assessed the peak during the breath-hold itself [8, 20-21]. Our approach circumvents these uncertainties by automatically considering a number of potential velocities in some extent from the above-mentioned points (switching the onset and/or ending of the test using such parameters as “Advance” and “Delay”), so as to select them in the most favorable way for the proband.
The introduction of the relatively simple but stable method, with would also be easy for the potential patient to tolerate is the main advantage of the presented automation of the calculation of the signal obtained during breath holding test. The automatic accurate identification of the steepest slope and adjustment for shifts simplifies the procedure, facilitating its adoption in clinical settings.
This study, while innovative in its approach to measuring CVR using an automatic calculation of the BHI, also has several limitations. The small sample size and design based on specific criteria and adjustments for starting and ending point shifts in just 8 participants are the most critical limitations. However, it should be emphasized that despite the small number of samples, it was possible to demonstrate lower variability in the results with repeated sampling than with the standardized approach to the BHI index. The participants were within a narrow age range and of the same ethnicity, the parameters may not be universally applicable across different populations, making it challenging to generalize the findings without extensive validation in diverse cohorts. Despite the automation of calculations, the accuracy of the method still relies on the patient’s ability to perform the breath-holding maneuver consistently. However, shortening the analysed time seems to have strongly stabilized the repeatability of the sample, as it was shown as the significant lowering of the variability in results in comparison to standard BHI measure. We used an analogue capnograph to monitor the correctness of the test execution, however numerical data were not collected, accounting for the limitation. In this study we propose a new approach but it lacks comprehensive comparison and validation against existing CVR measurement techniques other than BHI. By focusing on optimizing the calculation method for the most dynamic phase of the cerebrovascular response, there is a risk of overfitting the model to specific patterns of response. This could lead to less robust performance when the method is applied to individuals with atypical cerebrovascular responses to CO2-induced vasodilation. Finally, our study was performed on healthy volunteers, therefore its clinical value is limited and further studies that include patients with cerebrovascular conditions are needed to validate this methodology.
Conclusions
The proposed method of data analysis represents a step forward in the non-invasive assessment of cerebrovascular reactivity, as it could improve the accuracy and reliability of CVR measurements. Additional research is required to address this method’s limitations, validate its effectiveness across a broader range of patient populations with various cerebrovascular conditions and facilitate its integration into routine clinical practice.
Conflicts of interest
None.
Funding
Wroclaw Medical University (SUBZ.C220.24.053.2025) and the HeartBit 4.0 project.
References
| 1. |
Al-Khazraji BK, Shoemaker LN, Gati JS, Szekeres T, Shoemaker JK. Reactivity of larger intracranial arteries using 7 T MRI in young adults. J Cereb Blood Flow Metab [Internet]. 2019;39(7):1204–14. Available from: https://journals.sagepub.com/doi/10.1177/0271678X18762880.
|
| 2. |
Hoiland RL, Ainslie PN. CrossTalk proposal: The middle cerebral artery diameter does change during alterations in arterial blood gases and blood pressure. J Physiol [Internet]. 2016;594(15):4073–5. Available from: https://physoc.onlinelibrary.wiley.com/doi/10.1113/JP271981.
|
| 3. |
Brothers RM, Zhang R. CrossTalk opposing view: The middle cerebral artery diameter does not change during alterations in arterial blood gases and blood pressure. J Physiol [Internet]. 2016;594(15):4077–9. Available from: http://www.ncbi.nlm.nih.gov/pubmed/27010011.
|
| 4. |
Terborg C, Gora F, Weiller C, Röther J. Reduced Vasomotor Reactivity in Cerebral Microangiopathy. Stroke [Internet]. 2000;31(4):924–9. Available from: https://doi.org/10.1161/01.STR.31.4.924.
|
| 5. |
Pretnar-Oblak J, Sabovic M, Zaletel M. Associations between Systemic and Cerebral Endothelial Impairment Determined by Cerebrovascular Reactivity to Arginine. Endothelium [Internet]. 2007;14(2):73–80. Available from: http://www.tandfonline.com/doi/full/10.1080/10623320701346692.
|
| 6. |
Karlsson WK, Sørensen CG, Kruuse C. l-arginine and l-NMMA for assessing cerebral endothelial dysfunction in ischaemic cerebrovascular disease: A systematic review. Clin Exp Pharmacol Physiol [Internet]. 2017;44(1):13–20. Available from: https://onlinelibrary.wiley.com/doi/10.1111/1440-1681.12679.
|
| 7. |
Regenhardt RW, Nolan NM, Das AS, Mahajan R, Monk AD, LaRose SL, et al. Transcranial Doppler cerebrovascular reactivity: Thresholds for clinical significance in cerebrovascular disease. J Neuroimaging [Internet]. 2024;34(3):348–55. Available from: https://onlinelibrary.wiley.com/doi/10.1111/jon.13197.
|
| 8. |
Markus HS, Harrison MJ. Estimation of cerebrovascular reactivity using transcranial Doppler, including the use of breath-holding as the vasodilatory stimulus. Stroke [Internet]. 1992;23(5):668–73. Available from: https://www.ahajournals.org/doi/10.1161/01.STR.23.5.668.
|
| 9. |
Palazzo P, Maggio P, Passarelli F, Altavilla R, Altamura C, Pasqualetti P, et al. Lack of Correlation Between Cerebral Vasomotor Reactivity and Flow-Mediated Dilation in Subjects Without Vascular Disease. Ultrasound Med Biol [Internet]. 2013;39(1):10–5. Available from: https://linkinghub.elsevier.com/retrieve/pii/S0301562912005236.
|
| 10. |
Haussen DC, Katsnelson M, Rodriguez A, Campo N, Campo‐Bustillo I, Romano JG, et al. Moderate correlation between breath‐holding and CO 2 inhalation/hyperventilation methods for transcranial doppler evaluation of cerebral vasoreactivity. J Clin Ultrasound [Internet]. 2012;40(9):554–8. Available from: https://onlinelibrary.wiley.com/doi/10.1002/jcu.21944.
|
| 11. |
Tymko MM, Skow RJ, MacKay CM, Day TA. Steady-state tilt has no effect on cerebrovascular CO2 reactivity in anterior and posterior cerebral circulations. Exp Physiol. 2015;100(7):839–51.
|
| 12. |
Favre ME, Lim V, Falvo MJ, Serrador JM. Cerebrovascular reactivity and cerebral autoregulation are improved in the supine posture compared to upright in healthy men and women. PLoS One. 2020;15(3):1–20.
|
| 13. |
Webb AJS, Paolucci M, Mazzucco S, Li L, Rothwell PM. Confounding of Cerebral Blood Flow Velocity by Blood Pressure During Breath Holding or Hyperventilation in Transient Ischemic Attack or Stroke. Stroke [Internet]. 2020;51(2):468–74. Available from: https://www.ahajournals.org/doi/10.1161/STROKEAHA.119.027829.
|
| 14. |
van Beek AH, Claassen JA, Rikkert MGO, Jansen RW. Cerebral Autoregulation: An Overview of Current Concepts and Methodology with Special Focus on the Elderly. J Cereb Blood Flow Metab [Internet]. 2008;28(6):1071–85. Available from: https://journals.sagepub.com/doi/10.1038/jcbfm.2008.13.
|
| 15. |
Deegan BM, Sorond FA, Galica A, Lipsitz LA, O’Laighin G, Serrador JM. Elderly Women Regulate Brain Blood Flow Better Than Men Do. Stroke [Internet]. 2011;42(7):1988–93. Available from: https://www.ahajournals.org/doi/10.1161/STROKEAHA.110.605618.
|
| 16. |
Kozera GM, Dubaniewicz M, Zdrojewski T, Madej-Dmochowska A, Mielczarek M, Wojczal J, et al. Cerebral Vasomotor Reactivity and Extent of White Matter Lesions in Middle-Aged Men With Arterial Hypertension: A Pilot Study. Am J Hypertens [Internet]. 2010;23(11):1198–203. Available from: https://academic.oup.com/ajh/article-lookup/doi/10.1038/ajh.2010.152.
|
| 17. |
Settakis G, Páll D, Molnár C, Bereczki D, Csiba L, Fülesdi B. Cerebrovascular reactivity in hypertensive and healthy adolescents: TCD with vasodilatory challenge. J Neuroimaging. 2003;13(2):106–12.
|
| 18. |
Jung K, Lee S, Lee T. A Breath‐Holding Index Applied to the Internal Carotid Artery Siphon in Transcranial Doppler Studies. J Neuroimaging [Internet]. 2020;30(6):862–6. Available from: https://onlinelibrary.wiley.com/doi/10.1111/jon.12752.
|
| 19. |
Porter A, Burger M, Alwatban M, Hage B, Bashford GR. Analysis of Breath-Holding Index as an Assessment of Cerebrovascular Reactivity [Internet]. 2016. Available from: https://digitalcommons.unl.edu/ucareresearch/89/.
|
| 20. |
Alwatban M, Truemper EJ, Al‐rethaia A, Murman DL, Bashford GR. The Breath‐Hold Acceleration Index: A New Method to Evaluate Cerebrovascular Reactivity using Transcranial Doppler. J Neuroimaging [Internet]. 2018;28(4):429–35. Available from: https://onlinelibrary.wiley.com/doi/10.1111/jon.12508.
|
| 21. |
Settakis G, Lengyel A, Molnár C, Bereczki D, Csiba L, Fülesdi B. Transcranial Doppler study of the cerebral hemodynamic changes during breath-holding and hyperventilation tests. J Neuroimaging [Internet]. 2002;12(3):252–8. Available from: http://www.ncbi.nlm.nih.gov/pubmed/12116744.
|
