


Effects of prior antioxidant supplementation on quality of stored erythrocytes: vitamin C + vitamin E and vitamin C + N-acetylcysteine


Abstract
Background: The antioxidant status of donors may impact the quality of stored blood and its components. Therefore, oral antioxidant supplementation prior to blood donation could be a promising approach to improve the efficacy of stored erythrocytes.
Materials and methods: Wistar rats (3 months old, n = 5/group) were categorized into controls, antioxidant group 1 (vitamin C and vitamin E, VC + VE group), antioxidant group 2 (vitamin C and N-acetylcysteine, VC + NAC group). Experimental rats were supplemented for 30 days. Erythrocytes were stored in additive solution (AS-7) for 42 days and analyzed at two-week intervals.
Results: Hemoglobin increased on days 28 and 42 in both the antioxidant groups. Superoxide dismutase and catalase activities elevated during initial days and, glutathione peroxidase activity towards the end of storage in the antioxidant groups. Protein carbonyls and malondialdehyde levels decreased in the antioxidant groups. Glutathione levels increased on day 42 in VC + VE. Hemolysis was lower in the VC + VE group until day 28 and was similar in the VC + NAC group.
Conclusion: VC + VE and VC + NAC supplements protected hemoglobin, blood proteins and lipids from oxidation and elevated antioxidant defenses. Therefore, prior supplementation augments the antioxidant status and quality of stored blood.
Citation
Pallavi M, Rajashekaraiah V. Effects of prior antioxidant supplementation on quality of stored erythrocytes: vitamin C + vitamin E and vitamin C + N-acetylcysteine. Eur J Transl Clin Med. 2025;8(1):45-58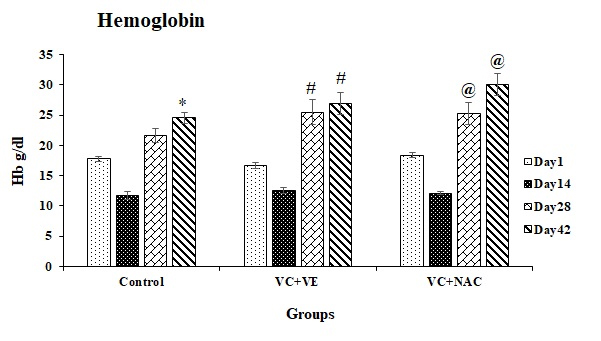


Abbreviations
- AS-7 – additive solution-7
- OS – oxidative Stress
- PS – phosphatidyl Serine
- VC – vitamin C
- VE – vitamin E
- NAC – N-acetylcysteine
- MetHb – Methemoglobin
- GSH – reduced glutathione
- GSSG – oxidized glutathione
- ROS – reactive oxygen species
- NADH – nicotinamide adenine dinucleotide
- NADPH – nicotinamide adenine dinucleotide phosphate
- H2O2 – hydrogen peroxide
Introduction
Erythrocytes experience physiological and biochemical modifications under blood bank conditions referred to as “storage lesions”. Oxidative stress (OS) leads to a decline in antioxidant defenses, oxidation of proteins and lipids, and phosphatidyl serine (PS) externalization [1-3].
Attenuation of oxidative stress could be a promising strategy to diminish storage lesions. Therefore, blood banking research continues to focus on enriching the antioxidant defenses to combat oxidative stress. It has been hypothesized, that enhancing the nutritional status of a donor prior to blood donation could improve the viability and efficacy of stored erythrocytes [4]. Therefore, the primary objective of this study was to explore, whether the antioxidant status of donors influences the quality of stored blood.
There are limited studies on the supplementation of donors with antioxidants. Supplementation of vitamin C and vitamin E resulted in a decrease in plasma malondialdehyde and hemolysis [5]. Nonetheless, the impact of these antioxidant supplements on the OS profile, antioxidant defenses and metabolism of stored erythrocytes has not been explored. The supplementation of β‐carotene, vitamin E, vitamin C and selenium decreased the release of hemoglobin and potassium and protected antioxidant enzymes [6].
Animal models offer a platform to mitigate the effects of donor variations, such as age, ethnicity, sex, genetics, and habits (such as smoking), which directly impact the characteristics of stored erythrocytes [7-9].
Therefore, this study aimed to investigate the influence of vitamin C + vitamin E and vitamin C + N-acetylcysteine supplements on the efficacy of banked erythrocytes.
Materials and methods
Ethical committee approval (IAEC/NCP/117/2022) was obtained from the Nargund College of Pharmacy (Bengaluru, India). Animal care and maintenance were in accordance with the ethical committee regulations.
Experimental design
Wistar rats [male, 3 months old, 160-170 g body weight (b.w)] were categorized into three groups (n = 5/group).
A) controls – distilled water (without any antioxidants);
B) antioxidant group 1 (VC + VE group) – vitamin C (400 mg/kg b.w) and vitamin E (50 mg/kg b.w);
C) antioxidant group 2 (VC + NAC group) – vitamin C (400 mg/kg b.w) and N-acetylcysteine (100 mg/kg b.w).
The rats were acclimatized in the animal house for one week and then orally supplemented for 30 days. Erythrocytes were isolated from whole blood and stored for 42 days in AS-7 (additive solution-7) [10]. Hemoglobin, hemolysis, and phosphatidyl serine externalization were measured in erythrocytes. Oxidative stress and antioxidant markers were analyzed in hemolysate at two-week intervals.
Erythrocyte separation
Erythrocytes were isolated by centrifugation at 3500 rpm at 4 ˚C for 20 minutes (min). The erythrocyte pellet was washed and resuspended in isotonic phosphate buffer to a final hematocrit of 50%.
Hemoglobin (Hb)
Hemoglobin content of the erythrocytes was measured by the cyanomethemoglobin method using Hemocor-D Kit and represented in terms of g/dl [11].
Superoxide Dismutase [SOD, EC 1.15.1.1]
Epinephrine was added to the hemolysate diluted in carbonate buffer and measured at 480 nm. SOD activity was expressed as Units/mg protein [12].
Catalase [CAT, EC 1.11.1.6]
Hemolysate was treated with absolute alcohol, 6.6 mM hydrogen peroxide (H2O2) and the absorbance was measured at 240 nm. Catalase activity was expressed as Units/mg protein [13].
Glutathione peroxidase [GPX, EC.1.11.1.9]
Glutathione reductase (0.24 units), and 10 mM glutathione (GSH) were added to hemolysate and preincubated for 10 min at 37˚C, followed by the addition of nicotinamide adenine dinucleotide phosphate (NADPH) in 0.1% sodium bicarbonate. The overall reaction was started by adding prewarmed H2O2 and the decrease in absorption was monitored at 340 nm for three min. The enzyme activity was expressed as Units/mg protein [14].
Protein Carbonyls (PrC)
An equal volume of 1% trichloroacetic acid (TCA) and the samples were suspended in 10 mM 2,4-dinitrophenyl hydrazine (DNPH). Samples were kept in the dark for 1 hour. An equal volume of 20% TCA was added and left in ice for 10 min, centrifuged at 3000 g, and the pellet was washed with ethanol-ethyl acetate mixture (1:1). The final pellet was dissolved in guanidine HCl, and absorbance was measured at 370 nm [15].
Protein Sulfhydryls (P-SH)
Hemolysate was treated with sodium phosphate buffer containing 0.5 mg/ml of Na2-EDTA and 2% sodium lauryl sulfate (SDS). 5,5'-dithiobis-2-nitrobenzoic acid (DTNB) was added to the above mixture, vortexed, and absorbance was measured at 412 nm [16].
Malondialdehyde (MDA)
Hemolysate samples were treated with 8.1% SDS, and incubated at room temperature for 10 min. 20% acetic acid was added followed by 0.6% thiobarbituric acid, and the samples were boiled until pink colour developed. Butanol-pyridine was added, and centrifuged for 5 min, and the absorbance was measured at 532 nm [17].
Thiobarbituric acid reactive substances (TBARS)
Hemolysate was treated with 0.9% NaCl and incubated at 37°C for 20 min. 0.8 M HCI containing 12.5% TCA and 1% thiobarbituric acid was boiled for 20 min and cooled. The absorbance was measured at 532 nm [18].
Total Antioxidant Capacity (TAC) Cupric ion-reducing antioxidant capacity – BCS assay [CUPRAC-BCS]
Hemolysate was treated with 0.25mM bathocuproinedisulfonic acid disodium salt (BCS) and the initial absorbance was measured at 490 nm. 0.5 mM Copper sulfate was added and incubated for 3 min, followed by the addition of Na2EDTA and read at 490 nm [19].
Glutathione (GSH)
Hemolysate was treated with 4% sulfosalicylic acid, and centrifuged at 2500 g for 15 min. The supernatant was treated with 10 mM DTNB and the absorbance was read at 412 nm [20].
Uric acid
Uric acid levels were determined by the Uricase/POD method kit from Aspen Laboratories [21].
Metabolic markers
Glucose
Glucose levels were assessed using the glucose oxidase and peroxidase (GOD-POD) method [22].
Lactate dehydrogenase (LDH)
Hemolysate was treated with the LDH reagent [a mixture of reagent 1 (80 mM Tris, 1.6 mM pyruvate, and 200 mM NaCl) and reagent 2 (0.2 mM NADH) at a ratio of 4:1], and incubated at 37˚C. The absorbance was measured at 340 nm [23].
Superoxides
Hemolysate was treated with cytochrome c (160 µM), incubated at 37°C and the absorbance was measured at 550 nm [24].
Nitrites
Hemolysate was added to the coupling reagent, incubated for 10 min and the absorbance was measured at 520 nm [25].
Hemolysis
A 5% suspension of packed erythrocytes were mixed with an equal volume of 8 mM H2O2 and incubated at 37°C. Hemolysis was determined by measuring the amount of Hb released into the supernatant at 540 nm [26].
Phosphatidyl Serine (PS) externalization by flow cytometry
The PS exposure on the erythrocyte membrane was analyzed by flow cytometry (CytoFLEX, Beckman Coulter, Inc. USA) according to FITC Annexin V Apoptosis Detection Kit I, BD Biosciences. The data was recorded with an excitation of 488 nm and emission of 530 nm [27], and analyzed by using the CytExpert software. Protein content was determined by Lowry et al. using bovine serum albumin as the standard [28].
Statistical analysis
Results are represented as mean ± standard error (SE) of 5 animals per group. Differences between the controls and antioxidant groups) and within the groups were analyzed by two-way ANOVA. Bonferroni post hoc test was performed. Pearson’s correlation coefficient was measured for the relevant markers. The values were considered significant at p < 0.05. Statistical analysis was performed using the GraphPad Prism software (version 6, GraphPad Software Inc., Boston, MA, USA).
Results
The significant changes were represented with p-values between the controls and antioxidant groups as well as the sub-groups (storage days).
Hemoglobin (Hb)
Hb levels were significant in all the groups in comparison to day 1. Hb levels increased by 38% (p < 0.05) on day 42 in controls with day 1. VC + VE showed increments of 53% (p < 0.001) and 61% (p < 0.0001) on days 28 and 42 respectively, compared to day 1. Hb levels increased by 37% (p < 0.05) and 63% (p < 0.0001) on days 28 and 42 respectively, in VC + NAC in comparison to day 1. Hb levels increased by 17% on day 28 in VC + VE and VC + NAC, and 22% on day 42 in VC + NAC compared to controls (Figure 1).
Figure 1. Hemoglobin levels in stored erythrocytes
*represents significant changes during storage in control with respect to day 1
# represents significant changes during storage in VC + VE with respect to day 1
@ represents significant changes during storage in VC + NAC with respect to day 1
Superoxide dismutase (SOD)
SOD activity was similar throughout the storage period in both control and VC + NAC groups, whereas decreased by 32% (p < 0.01) on day 14 in VC + VE compared to day 1. SOD activity increased by 23% on day 1 in VC + VE & VC + NAC compared to controls, and 25% on day 14 in VC + NAC compared to controls & VC + VE (Figure 2A).
Catalase (CAT)
Catalase activity was similar throughout the storage in controls, whereas varied in the antioxidant groups. CAT activity decreased by 35% and 46% on days 14 and 28 respectively, in the VC + VE compared to day 1. CAT activity showed decrements of 56%, 32%, and 45% on days 14, 28, and 42 respectively, in VC + NAC compared to day 1. CAT activity showed increments of 47% and 72 % on day 1 in VC + VE and VC + NAC groups respectively, compared to controls. CAT activity increased by 35% and 47% on day 28 in VC + NAC compared to Control and VC + VE respectively (Figure 2B).
Glutathione Peroxidase (GPX)
GPX activity increased in antioxidant groups towards the end of storage period. GPX activity decreased by 27% on day 14 and normalized on day 42 in controls compared to day 1. GPX activity increased by 64% and 105% in VC + VE and 57% and 41% in VC + NAC on days 28 and 42 respectively, compared to day 1. Increments of 36% & 80% (day 14), 25% & 52% (day 28), and 49% & 31% (day 42) were observed in VC + VE & VC + NAC respectively, compared to controls (Figure 2C).
Figure. 2A. Superoxide dismutase activity in stored erythrocytes;
2B. Catalase activity in stored erythrocytes;
2C. Glutathione peroxidase activity in stored erythrocytes.
Values are expressed as mean ± SE from 5 samples. Significance between the groups was analyzed by two-way ANOVA followed by Bonferroni post test, using GraphPad Prism 6 software.
# represents significant changes during storage in VC + VE with respect to day 1.
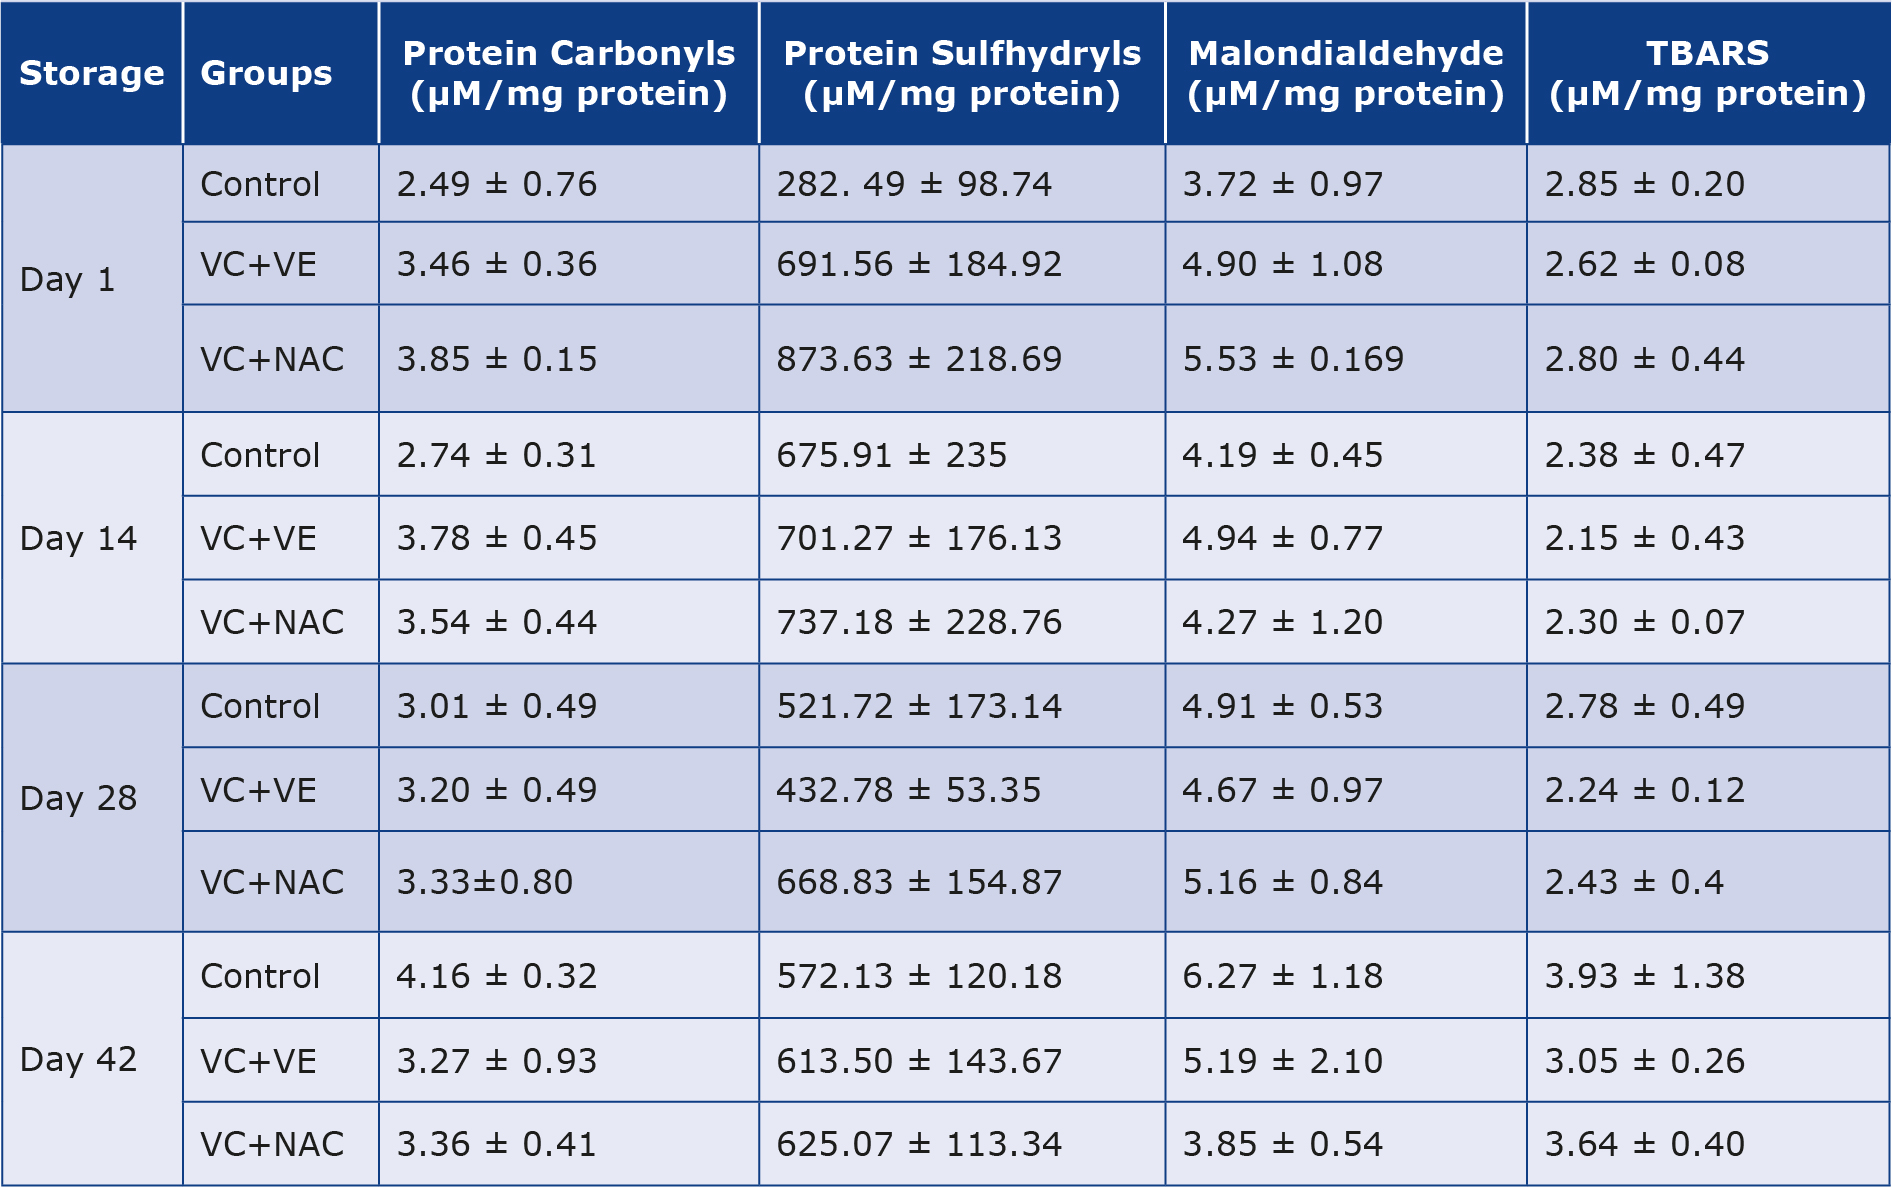
Protein Carbonyls (PrC)
Carbonyls increased by 21% and 67% on days 28 and 42 respectively, in controls compared to day 1, whereas decreased towards the end of storage in both the antioxidant groups (Table 1).
Table 1. Antioxidant effects of melatonin [32]
Values are expressed as mean ± SE from 5 samples. Significance between the groups was analyzed by two-way ANOVA followed by Bonferroni post test, using GraphPad Prism 6 software. TBARS – Thiobarbituric acid reactive substances.
Protein Sulfhydryls (P-SH)
Sulfhydryls increased by 139%, 85%, and 103% on days 14, 28, and 42 respectively, in controls compared to day 1. Sulfhydryls remained constant throughout storage, whereas lowered by 37% on day 28 and normalized on day 42 in VC + VE with respect to day 1. Sulfhydryls decreased by 25% on days 28 and 42 in VC + NAC in comparison to day 1. Sulfhydryls increased by 1-fold and 2-fold in VC + VE and VC + NAC groups respectively, on day 1 in comparison to controls. VC + NAC showed increments in sulfhydryls on day 1 (26%) and day 28 (55%) when compared to VC + VE (Table 1).
Malondialdehyde (MDA)
Controls showed increments of 32% and 68% on days 28 and 42 respectively, compared to day 1. MDA levels remained constant throughout the storage in VC + VE, whereas decreased by 23% and 30% on days 14 and 42 respectively, in VC + NAC with day 1. VC + NAC showed decrements of 39% and 26% on day 42 compared to controls and VC + VE respectively (Table 1).
Thiobarbituric acid reactive substances (TBARS)
Antioxidant groups had lower levels of TBARS in comparison to Controls. TBARS decreased by 14% on day 28 in VC + VE and VC + NAC respectively, compared to day 1. TBARS were lower by 23% on day 42 in VC + VE compared to Controls (Table 1).
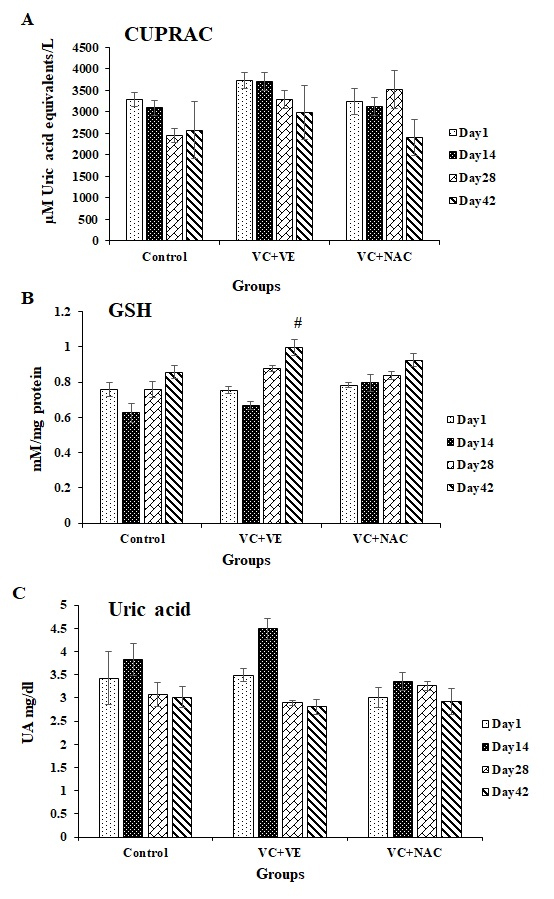
Total Antioxidant Capacity (TAC)
TAC was higher in both the antioxidant groups compared to controls. TAC decreased by 23% on days 28 and 42 respectively, in controls with day 1. Decrements of 20% and 26% were observed in VC + VE and VC + NAC respectively, on day 42 compared to day 1. TAC showed increments of 20% (day 14) and 34% (day 28) in VC + VE and 43% (day 28) in VC + NAC compared to controls (Figure 3A).
Glutathione (GSH)
The GSH levels were significant towards the end of storage in VC + VE. GSH levels decreased by 17% on day 14 and normalized towards the end of storage in controls. GSH levels increased by 32% (p < 0.01) in VC + VE and 18% in VC + NAC on day 42 compared to day 1. VC + VE showed increments of 16% on days 28 and 42 compared to controls. GSH increased by 23% on day 14 in VC + NAC compared to controls and VC + VE respectively (Figure 3B).
Uric acid
Although the variations were similar, uric acid levels were higher in the antioxidant groups throughout the storage (Figure 3C).
Figure 3A. CUPRAC in stored erythrocytes
3B. Glutathione in stored erythrocytes
3C. Uric acid in stored erythrocytes
Values are expressed as mean ± SE from 5 samples. Significance between the groups was analyzed by Two-way ANOVA followed by Bonferroni post test, using GraphPad Prism 6 software.
# represents significant changes during storage in VC + VE with respect to day 1
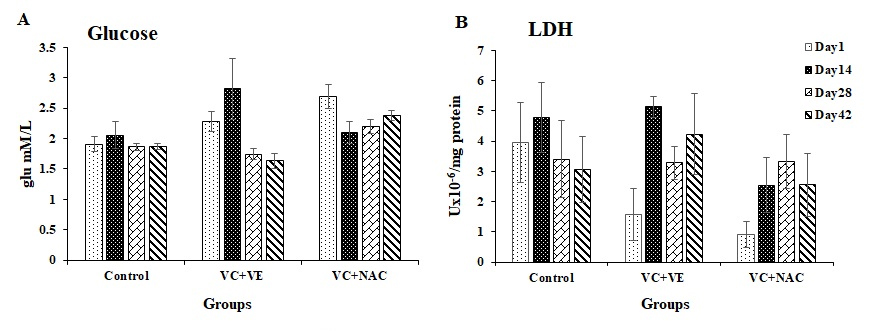
Glucose
Glucose levels were similar throughout storage in controls, whereas they varied in the antioxidant groups. Glucose levels varied by 23% on day 14 and 26% on days 28 and 42 in VC + VE with day 1. Glucose levels decreased by 20% on days 14 and 28 in VC + NAC compared to day 1. Glucose levels increased by 20% (day 1) and 37% (day 14) in VC + VE compared to controls. Glucose levels elevated in VC + NAC by 41%, 18%, and 27% on days 1, 28, and 42 respectively, compared to controls and 26% and 46 % on days 28 and 42 compared to VC + VE (Figure 4A).
Lactate dehydrogenase (LDH)
LDH activity decreased by 60% and 77% on day 1 in VC + VE and VC + NAC respectively, compared to controls (Figure 4B).
Figure 4A. Glucose in stored erythrocytes
4B. Lactate dehydrogenase in stored erythrocytes
Values are expressed as mean ± SE from 5 samples. Significance between the groups was analyzed by two-way ANOVA followed by Bonferroni post test, using GraphPad Prism 6 software.
Superoxides
Superoxide levels were similar in all the groups throughout the storage. Superoxides increased from 0.31 mM/mg protein (day 1) to 0.50 mM/mg protein (days 28 and 42) in controls. Superoxides increased from 0.34 mM/mg protein (day 1) to 0.48 mM/mg protein (day 14) and were stable until day 42 in VC + VE. Superoxides varied from 0.4 mM/mg protein (day 1) to 0.45 mM/mg protein (day 28), and 0.55 mM/mg protein (day 42) in VC + NAC.
Nitrites
Variations were similar in all the groups. Nitrites varied on day 14 (2.89 mM/mg protein) and day 28 (2.69 mM/mg protein) compared to day 1 (2.45 mM/mg protein) in controls. Nitrites increased on day 28 (3.13 mM/mg protein) in comparison to day 1 (2.62 mM/mg protein) and then normalized in VC + VE. Nitrite varied from 2.96 mM/mg protein (day 1) to 2.12 mM/mg protein (day 42) in VC + NAC.
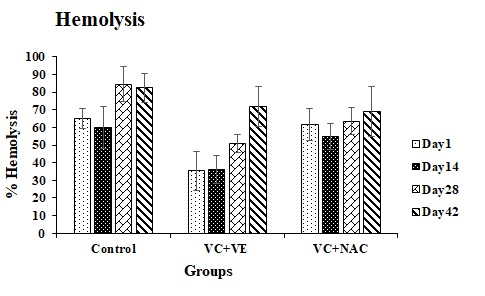
Hemolysis
VC + VE showed a decrease of 43% on days 1, 14 and 28 compared to controls and 74%, 52%, and 25% on days 1, 14 and 28 compared to VC + NAC. VC + NAC showed decrements of 25% and 16% on days 28 and 42 in comparison to controls (Figure 5).
Figure 5. Hemolysis in stored erythrocytes
Values are expressed as mean ± SE from 5 samples. Significance between the groups was analyzed by two-way ANOVA followed by Bonferroni post test, using GraphPad Prism 6 software.
Phosphatidyl Serine (PS) externalization
The variations were observed in the PS exposure with storage. PS exposure increased by 9-fold on day 42 in controls compared to day 1 (0.51%). VC + VE and VC + NAC groups showed increments of 2-fold and 1-fold respectively, on day 42 in comparison to day 1 (VC + VE – 1.27%; VC + NAC – 1.46%).
Discussion
Storage lesions accumulate in erythrocytes when the oxidants overwhelm the antioxidant defenses. Hence, antioxidant augmentation could be a promising approach to maintain the microenvironment equilibrium.
VC + VE group
In this study the Hb levels increased towards the end of storage in the VC + VE group indicates the reverse conversion of methemoglobin (metHb) to Hb by vitamin C and vitamin E. We also noted this in our previous study, where the combination of VC and VE as additives increased Hb levels [29]. Atyabi et al. also reported that the combination of vitamin C and E was effective in reducing sodium nitrite-induced metHb formation [30].
SOD dismutates superoxide into H2O2, and catalase scavenges H2O2. This was evidenced by an inverse correlation between SOD activity and superoxide levels (r = –0.9447) and a positive correlation between SOD and catalase activity in the VC + VE group (r = 0.8586). SOD and catalase activities were higher in the VC + VE group on day 1, indicating that supplemented antioxidants upregulated the antioxidant enzymes. Gultekin and Bhogade have also reported that vitamin C and E upregulates antioxidant enzymes [31-32]. However, SOD and catalase activity decreased on day 14 in VC + VE reflecting the superoxide and H2O2 scavenging activity of vitamin C and vitamin E [5, 33-34]. Therefore, superoxide levels reached a plateau from day 14 onwards in the VC + VE group.
GPX scavenges H2O2 at lower levels by using GSH as a cofactor and oxidizes GSH (reduced glutathione) to GSSG (oxidized glutathione) [35]. Supplementation of vitamin C and vitamin E increases cellular glutathione levels, thereby upregulating the GPX activity [36-37]. Previous studies also reported that supplementation of vitamin C and vitamin E increases GPX activity [38-39]. Similarly in this study, glutathione levels and GPX activity elevated towards the end of storage in the VC + VE group with a significant correlation between GSH and GPX activity (r = 0.9389) indicating that VC + VE enhanced antioxidant defenses.
Protein carbonyls declined in the VC + VE group with storage, suggesting the protective influence of Vitamin C and Vitamin E against protein oxidation, evidenced in our earlier in vitro study [29]. Goldfarb et al. and Marino et al. have also reported that vitamin C and E supplementation reduced protein carbonyl formation during exercise-induced and alcohol-induced oxidative stress, respectively [40-41]. Vitamin C and E synergistically quench the free radicals generated in the lipid core of the erythrocyte membrane and protect from protein oxidation, which was also evidenced in our findings [42]. Carbonyl levels increased towards the end of the storage in controls, indicating protein damage resulting from oxidative insult, which was also observed by Jana et al. [43].
Higher sulfhydryl levels in the VC + VE group until 2nd week of storage suggest the protection of sulfhydryl groups against oxidation or the reversible conversion of disulfides to sulfhydryls [44]. Vitamin C and vitamin E supplementation have been associated with elevated cellular GSH and sulfhydryls [36-37]. However, the lower levels of sulfhydryls on day 28 in the VC+VE group imply the conversion of GSH to GSSG, evidenced by an elevation in GPX and nitrites. Sulfhydryls normalized on day 42, due to the reversible conversion of GSSG to GSH due to the action of VC and VE [45].
The MDA levels were similar throughout the storage in the VC + VE group, indicating the lipid peroxyl radical scavenging activity of vitamin C and vitamin E [35, 46-47]. Vitamin C and vitamin E synergistically impede the progression of lipid peroxidation reactions in plasma lipoproteins and membranes [35]. Nonetheless, MDA levels peaked towards the end of storage in controls, indicating that inherent antioxidant defenses were inadequate to mitigate ROS attack on membrane lipids.
Oxidative damage to membrane lipids and proteins contributes to elevations in LDH activity [48]. LDH increased rapidly during the first 4 weeks of storage in controls. Verma et al. and Latham et al. also reported an increase in LDH activity during erythrocyte storage [49-50]. However, the VC + VE protected erythrocytes from LDH leakage until two weeks of storage. This indicates reduced oxidative damage to membrane proteins and lipids, resulting in lower hemolysis. Czubak et al., also demonstrated that VC and VE synergistically protect human erythrocytes from LDH leakage up to 20 days [51].
Total antioxidant capacity (TAC) was relatively higher in the VC + VE group, depicting that vitamin C and vitamin E synergistically enhanced antioxidant capacity. TAC was directly proportional to glutathione and uric acid (endogenous antioxidants). However, TAC decreased towards the end of storage due to oxidative stress. Similarly, Czubak et al. reported a storage-dependent decrease in antioxidant capacity during erythrocyte storage [51].
Glucose levels were higher on day 14 and declined towards the end of storage in the VC + VE group, which can be attributed to the higher glucose consumption by erythrocytes due to an increase in their metabolic activity [52]. Glucose serves as a crucial substrate for both glycolysis and the pentose phosphate pathway to generate NADH and NADPH essential to reduce methemoglobin, which correlated with higher hemoglobin levels towards the end of storage [53]. The effective glucose metabolism plays a role in regulating glutathione levels, thereby protecting the sulfhydryl groups of hemoglobin from oxidation, which was evidenced with higher glutathione levels [35].
Phosphatidyl serine (PS) exposure on the outer leaflet of the erythrocyte membrane indicates storage lesions and the signals for apoptotic senescence [54]. The percentage of PS-exposing cells increases with storage, which was evidenced in our results [48, 55]. However, PS externalization was comparatively lower in VC + VE suggesting that supplementation of vitamin C and vitamin E reduced apoptosis, which also corroborates with the findings of Huang et al. [56].
Hemolysis is a result of protein and lipid oxidation. Vitamin C decreases the tocopheroxyl radicals in the membrane during the lipid-aqueous phase transition [57]. Vitamin C and vitamin E act synergistically to prevent the propagation of oxidation in erythrocyte membranes and hemolysis, which was evident in the hemolysis results [48, 51, 58]. Sakarya et al. and Claro et al., also reported that vitamin C and E attenuates the oxidation of erythrocyte membrane [50, 59].
VC + NAC group
The elevations in Hb levels towards the end of storage in VC + NAC could be due to the reverse conversion of metHb to Hb by the antioxidants. Vitamin C and NAC reduce metHb formation, which was evidenced in the Hb results [60-61].
SOD and catalase activities increased on day 1 in the VC + NAC group, indicating the upregulation of the antioxidant enzymes by vitamin C and NAC supplementation [31, 62]. Catalase activity decreased from day 14 in VC + NAC indicating the H2O2 scavenging activity of vitamin C and NAC [32, 63]. Consequently, the lower levels of H2O2 towards the end of storage were further mitigated by GPX. There is a positive correlation between GSH and GPX activity towards the end of storage (r = 0.660).
Protein carbonyls declined towards the end of storage in VC + NAC, indicating the protective effect of vitamin C and NAC against protein oxidation. Goldfarb et al. and Banaclocha et al. reported that Vitamin C and NAC decrease protein carbonyl formation against exercise and age-related oxidative stress, respectively [40, 64]. MDA levels also decreased towards the end of storage in the VC + NAC group which is consistent with the study by Pallotta et al. [65]. NAC indirectly contributes to lipid peroxyl radical scavenging activity by providing GSH for the reduction of ascorbate radicals to ascorbic acid [66].
Sulfhydryl levels were higher in VC + NAC compared to VC + VE suggesting GSH replenishment due to supplementation of NAC. Pallotta et al. reported that the storage of human erythrocytes with vitamin C and NAC resulted in higher GSH levels till 42 days [65]. Grinberg et al. also demonstrated that NAC protected erythrocytes from oxidative stress by restoring cellular glutathione [67]. VC + NAC protected lipids from oxidation as evidenced by enhanced endogenous antioxidants such as uric acid, glutathione and total antioxidant capacity.
LDH activity increased rapidly during the first 4 weeks of storage in controls whereas, the VC + NAC group showed a lower LDH release reflecting decreased erythrocyte damage as evidenced by reduced hemolysis and PS exposure. Glucose levels were higher in the VC + NAC group compared to controls. Glucose metabolism efficiently maintained GSH and thus protected hemoglobin and membrane from oxidation [35, 53].
Conclusion
Antioxidant combination (VC + VE and VC + NAC) supplements protected hemoglobin, blood proteins, and lipids from oxidation, and enhanced antioxidant defenses. VC + VE elevated glutathione levels and lowered hemolysis. VC + VE was effective against hemolysis compared to VC + NAC due to their synergistic action. VC + NAC was beneficial as it lowered LDH leakage and apoptosis. Both the antioxidant combinations have a positive influence on the efficacy of stored erythrocytes. Our results imply that prior supplementation augments the antioxidant status and influences the quality of stored blood.
Acknowledgments
The authors acknowledge Dr. Leela Iyengar, Dr. Soumya Ravikumar, Dr. Carl Hsieh, Dr. Manasa Mithun, Ms. Magdalene Christina Rajanand, Anusha Berikai Ananthakrishna, Darmavaram Sravani, and JAIN (Deemed-to-be University) for their support.
Funding
The Authors did not receive any specific grant for this research from funding agencies in the public, commercial or not-for-profit sectors.
Conflict of Interest
There are no conflicts of interest to declare.
-------------
Image source – DeepAI (public domain)
References
| 1. |
Yoshida T, Prudent M, D’Alessandro A. Red blood cell storage lesion: causes and potential clinical consequences. Blood Transfus. 2019;17(1):27–52. Available from: https://doi.org/10.2450/2019.0217-18.
|
| 2. |
Bardyn M, Tissot JD, Prudent M. Oxidative stress and antioxidant defenses during blood processing and storage of erythrocyte concentrates. Transfus Clin Biol. 2018;25(1):96–100. Available from: https://doi.org/10.1016/j.tracli.2017.08.001.
|
| 3. |
Dinkla S, Peppelman M, Van Der Raadt J, Atsma F, Novotný VM, Van Kraaij MG, Joosten I, Bosman GJ. Phosphatidylserine exposure on stored red blood cells as a parameter for donor-dependent variation in product quality. Blood Transfus. 2014;12(2):204–9. Available from: https://doi.org/10.2450/2013.0106-13.
|
| 4. |
Addis PB, St. Cyr JA. Nutritional Supplementation of Donors May Improve Outcomes Following the Transfusion of Stored Red Blood Cells. J Diet Supplement. 2017;14(4):485–8. Available from: https://doi.org/10.1080/19390211.2016.1272660.
|
| 5. |
Knight JA, Blaylock RC, Searles DA. The effect of vitamins C and E on lipid peroxidation in stored erythrocytes. Ann Clin Lab Sci. 1993;23(1):51–6. Available from: http://www.annclinlabsci.org/content/23/1/51.short.
|
| 6. |
Racek J, Herynkovà R, Holeček V, Jeřábek Z, Sláma V. Influence of antioxidants on the quality of stored blood. Vox Sang. 1997;72(1):16–9. Available from: https://doi.org/10.1159/000461951.
|
| 7. |
D’Alessandro A, Fu X, Kanias T, Reisz JA, Culp-Hill R, Guo Y, Gladwin MT, Page G, Kleinman S, Lanteri M, Stone M. Donor sex, age and ethnicity impact stored red blood cell antioxidant metabolism through mechanisms in part explained by glucose 6-phosphate dehydrogenase levels and activity. Haematologica. 2021;106(5):1290–1302. Available from: https://doi.org/10.3324/haematol.2020.246603.
|
| 8. |
Längst E, Tissot JD, Prudent M. Storage of red blood cell concentrates: Clinical impact. Transfus Clin Biol. 2021;28(4):397–402. Available from: https://doi.org/10.1016/j.tracli.2021.08.344.
|
| 9. |
Jordan A, Chen D, Yi QL, Kanias T, Gladwin MT, Acker JP. Assessing the influence of component processing and donor characteristics on quality of red cell concentrates using quality control data. Vox Sang. 2016;111(1):8–15. Available from: https://doi.org/10.1111/vox.12378.
|
| 10. |
Hsieh C, Prabhu NS, Rajashekaraiah V. Influence of AS-7 on the storage lesion in young and old circulating erythrocytes. Transfus Apher Sci. 2020;59(6):102905. Available from: https://doi.org/10.1016/j.transci.2020.102905.
|
| 11. |
Hawk FB. Physiological chemistry. New York: Tata McGraw Hill; 1965.
|
| 12. |
Misra HP, Fridovich I. The role of superoxide dismutase anion in the auto oxidation of epinephrine and a simple assay for superoxide dismutase. J Biol Chem. 1972;247(10):3170–5. Available from: https://doi.org/10.1016/S0021-9258(19)45228-9.
|
| 13. |
Aebi H. Catalase in vitro. Methods Enzymol. 1984;105:121–6. Available from: https://doi.org/10.1016/S0076-6879(84)05016-3.
|
| 14. |
Flohe L, Gunzler WA. Assays of glutathione peroxidase. Methods Enzymol. 1984;105:114–20. Available from: https://doi.org/10.1016/S0076-6879(84)05015-1.
|
| 15. |
Reznick AZ, Packer L. Oxidative damage to protein: spectrophotometric method for carbonyl assay. Methods Enzymol. 1994;233:357–63. Available from: https://doi.org/10.1016/S0076-6879(94)33041-7.
|
| 16. |
Habeeb AFSA. Reaction of protein sulfhydryl groups with Ellman’s reagent. Methods Enzymol. 1972;25:457–64. Available from: https://doi.org/10.1016/S0076-6879(72)25041-8.
|
| 17. |
Ohkawa H, Ohishi N, Yagi K. Assay for lipid peroxidation in animal tissues by thiobarbituric acid reaction. Anal Biochem. 1979;95(2):351–8. Available from: https://doi.org/10.1016/0003-2697(79)90738-3.
|
| 18. |
Bar-Or D, Rael LT, Lau EP, Rao NK, Thomas GW, Winkler JV, Yukl RL, Kingston RG, Curtis CG. An analog of the human albumin N-terminus (Asp-Ala-His-Lys) prevents formation of copper-induced reactive oxygen species. Biochem Biophys Res Commun. 2001;284(3):856–62. Available from: https://doi.org/10.1006/bbrc.2001.5042.
|
| 19. |
Campos C, Guzmán R, López-Fernández E, Casado A. Evaluation of the copper (II) reduction assay using bathocuproinedisulfonic acid disodium salt for the total antioxidant capacity assessment: the CUPRAC-BCS assay. Anal Biochem. 2009;392(1):37–44. Available from: https://doi.org/10.1016/j.ab.2009.05.024.
|
| 20. |
Beutler E, Duran O, Kelley BM. Modified procedure for the estimation of reduced glutathione. J Lab Clin Med. 1963;61:882–8.
|
| 21. |
Thomas L, editor. Clinical laboratory diagnostics: use and assessment of clinical laboratory results. TH-books Verlagsgesellschaft; 1998.
|
| 22. |
Basak A. Development of a rapid and inexpensive plasma glucose estimation by two point kinetic method based on glucose oxidase- peroxidase enzymes. Indian J Clin Biochem. 2007;22:156–60. Available from: https://doi.org/10.1007/BF02912902.
|
| 23. |
Buhl SN, Jackson KY, Graffunder B. Optimal reaction conditions for assaying human lactate dehydrogenase pyruvate-to-lactate at 25, 30, and 37˚C. Clin Chem. 1978;24(2):261–6. Available from: https://doi.org/10.1093/clinchem/24.2.261.
|
| 24. |
Olas B, Wachowicz B. Resveratrol and vitamin C as antioxidants in blood platelets. Thromb Res. 2002;106(2):143–8. Available from: https://doi.org/10.1016/S0049-3848(02)00101-9.
|
| 25. |
Yegin SC, Yur F, Çetın S, Güder A. Effect of Lycopene on Serum Nitrite-Nitrate Levels in Diabetic Rats. Indian J Pharm Sci. 2015;77(3);357–60. Available from: https://doi.org/10.4103/0250-474x.159676.
|
| 26. |
Senturk UK, Gunduz F, Kuru O, Aktekin MR, Kipmen D, Yalçin O, Bor-Küçükatay M, Yeşilkaya A, Başkurt OK. Exercise-induced oxidative stress affects erythrocyte in sedentary rats but not exercise-trained rats. J Appl Physiol. 2001;91(5):1999–2004. Available from: https://doi.org/10.1152/jappl.2001.91.5.1999.
|
| 27. |
Antosik A, Czubak K, Gajek A, Marczak A, Glowacki R, Borowczyk K, Zbikowska HM. Influence of pre-storage irradiation on the oxidative stress markers, membrane integrity, size and shape of the cold stored red blood cells. Transfus Med Hemother. 2015;42(3):140–8. Available from: https://doi.org/10.1159/000371596.
|
| 28. |
Lowry OH, Rosenberg NJ, Farr AL, Randall RJ. Protein measurements with Folin-phenol reagent. J Biol Chem. 1951;193:265–75.
|
| 29. |
Pallavi M, Rajashekaraiah V. Synergistic activity of vitamin-C and vitamin-E to ameliorate the efficacy of stored erythrocytes. Transfus Clin Biol. 2023;30(1):87–95. Available from: https://doi.org/10.1016/j.tracli.2022.09.002.
|
| 30. |
Atyabi N, Yasini SP, Jalali SM, Shaygan H. Antioxidant effect of different vitamins on methemoglobin production: An in vitro study. Vet Res Forum. 2012;3(2):97–101. Available from: https://pmc.ncbi.nlm.nih.gov/articles/PMC4312803/.
|
| 31. |
Gultekin F, Delibas N, Yasar S, Kilinc I. In vivo changes in antioxidant systems and protective role of melatonin and a combination of vitamin C and vitamin E on oxidative damage in erythrocytes induced by chlorpyrifos-ethyl in rats. Arch Toxicol. 2001;75:88–96. Available from: https://doi.org/10.1007/s002040100219.
|
| 32. |
Bhogade RB, Suryakar AN, Joshi NG, Patil RY. Effect of vitamin E supplementation on oxidative stress in hemodialysis patients. Indian J Clin Biochem. 2008;23:233–7. Available from: https://doi.org/10.1007/s12291-008-0052-0.
|
| 33. |
Pehlivan FE. Vitamin C: An antioxidant agent. Vitamin C. 2017;2:23–35. Available from: https://www.intechopen.com/chapters/56013?affiliate=30&source=&subid2=&subid=3psdb09qw8cfvztjcq006h&vid=fUOez3Avy5qaX2NZKXRDqXbXKx.
|
| 34. |
Lassnigg A, Punz A, Barker R, Keznickl P, Manhart N, Roth E, Hiesmayr M. Influence of intravenous vitamin E supplementation in cardiac surgery on oxidative stress: a double-blinded, randomized, controlled study. Br J Anaesth. 2003;90(2):148–54. Available from: https://doi.org/10.1093/bja/aeg042.
|
| 35. |
Çimen MYB. Free radical metabolism in human erythrocytes. Clin Chim Acta. 2008;390(1-2):1–11. Available from: https://doi.org/10.1016/j.cca.2007.12.025.
|
| 36. |
Johnston CS, Meyer CG, Srilakshmi JC. Vitamin C elevates red blood cell glutathione in healthy adults. Am J Clin Nutr. 1993;58(1):103-5. Available from: https://doi.org/10.1093/ajcn/58.1.103.
|
| 37. |
Jain SK, McVIE RO, Smith TI. Vitamin E supplementation restores glutathione and malondialdehyde to normal concentrations in erythrocytes of type 1 diabetic children. Diabetes Care. 2000;23(9):1389–94. Available from: https://doi.org/10.2337/diacare.23.9.1389.
|
| 38. |
Madhikarmi NL, Murthy KR. Antioxidant enzymes and oxidative stress in the erythrocytes of iron deficiency anemic patients supplemented with vitamins. Iran Biomed J. 2014;18(2):82–7. Available from: https://pmc.ncbi.nlm.nih.gov/articles/PMC3933916/.
|
| 39. |
Cinar M, Yildirim E, Yigit AA, Yalcinkaya I, Duru O, Kisa U, Atmaca N. Effects of dietary supplementation with vitamin C and vitamin E and their combination on growth performance, some biochemical parameters, and oxidative stress induced by copper toxicity in broilers. Biol Trace Elem Res. 2014;158:186–96. Available from: https://doi.org/10.1007/s12011-014-9926-6.
|
| 40. |
Goldfarb AH, Patrick SW, Bryer S, You T. Vitamin C supplementation affects oxidative-stress blood markers in response to a 30-minute run at 75% VO2max. Int J Sport Nutr Exerc Metab. 2005;15(3):279–90. Available from: https://doi.org/10.1123/ijsnem.15.3.279.
|
| 41. |
Marino MD, Aksenov MY, Kelly SJ. Vitamin E protects against alcohol-induced cell loss and oxidative stress in the neonatal rat hippocampus. Int J Dev Neurosci. 2004;22(5-6):363–77. Available from: https://doi.org/10.1016/j.ijdevneu.2004.04.005.
|
| 42. |
Vani R, Shiva Shankar Reddy CS, Asha Devi S. Oxidative stress in erythrocytes: a study on the effect of antioxidant mixtures during intermittent exposures to high altitude. Int J Biometeorol. 2010;54:553–62. Available from: https://doi.org/10.1007/s00484-010-0304-6.
|
| 43. |
Jana S, Kassa T, Wood F, Hicks W, Alayash AI. Changes in hemoglobin oxidation and band 3 during blood storage impact oxygen sensing and mitochondrial bioenergetic pathways in the human pulmonary arterial endothelial cell model. Front Physiol. 2023;14:1278763. Available from: https://doi.org/10.3389/fphys.2023.1278763.
|
| 44. |
Cao Y, Qu HJ, Li P, Wang CB, Wang LX, Han ZW. Single dose administration of L-carnitine improves antioxidant activities in healthy subjects. Tohoku J Exp Med. 2011;224:209–13. Available from: https://doi.org/10.1620/tjem.224.209.
|
| 45. |
Hsieh C, Rajashekharaiah V. Influence of L-carnitine on stored rat blood: a study on plasma. Turkish J Hematol. 2017;34(4):328. Available from: https://doi.org/10.4274/tjh.2016.0343.
|
| 46. |
Halliwell B. Vitamin C: antioxidant or pro-oxidant in vivo?. Free Radic Res. 1996;25(5):439–54. Available from: https://doi.org/10.3109/10715769609149066.
|
| 47. |
Traber MG, Atkinson J. Vitamin E, antioxidant and nothing more. Free Radic Biol Med. 2007;43:4–15. Available from: https://doi.org/10.1016/j.freeradbiomed.2007.03.024.
|
| 48. |
Antosik A, Czubak K, Cichon N, Nowak P, Zbikowska H. Vitamin E analogue protects red blood cells against storage-induced oxidative damage. Transfus Med Hemother. 2018;45(5):347–54. Available from: https://doi.org/10.1159/000486605.
|
| 49. |
Verma M, Dahiya K, Malik D, Sehgal PK, Devi R, Soni A, Ghalaut VG. Effect of blood storage on complete biochemistry. J Blood Disord Transfus. 2015;6(6):1–4. Available from: http://dx.doi.org/10.4172/2155-9864.1000329.
|
| 50. |
Latham JT JR, Bove JR, Weirich FL. Chemical and hematologic changes in stored CPDA-1 blood. Transfusion. 1982; 22(2):158–9. Available from: https://doi.org/10.1046/j.1537-2995.1982.22282177126.x.
|
| 51. |
Czubak K, Antosik A, Cichon N, Zbikowska HM. Vitamin C and Trolox decrease oxidative stress and hemolysis in cold-stored human red blood cells. Redox Rep. 2017;22(6):445–50. Available from: https://doi.org/10.1080/13510002.2017.1289314.
|
| 52. |
Paglia G, D’Alessandro A, Rolfsson Ó, Sigurjónsson OE, Bordbar A, Palsson S, Nemkov T, Hansen KC, Gudmundsson S, Palsson BO. Biomarkers defining the metabolic age of red blood cells during cold storage. Blood. 2016;128(13):e43–50. Available from: https://doi.org/10.1182/blood-2016-06-721688.
|
| 53. |
Siems WG, Sommerburg O, Grune T. Erythrocyte free radical and energy metabolism. Clin Nephrol. 2000;53:S9–S17. Available from: https://europepmc.org/article/med/10746800.
|
| 54. |
Stewart A, Urbaniak S, Turner M, Bessos H. The application of a new quantitative assay for the monitoring of integrin‐associated protein CD47 on red blood cells during storage and comparison with the expression of CD47 and phosphatidylserine with flow cytometry. Transfusion. 2005;45(9):1496–503. Available from: https://doi.org/10.1111/j.1537-2995.2005.00564.x.
|
| 55. |
Öhlinger T, Müllner EW, Fritz M, Werning M, Baron-Stefaniak J, Jungbauer C, Baron DM, Salzer U. Storage of packed red blood cells impairs an inherent coagulation property of erythrocytes. Front Physiol. 2022;13:1021553. Available from: https://doi.org/10.3389/fphys.2022.1021553.
|
| 56. |
Huang RF, Huang SM, Lin BS, Hung CY, Lu HT. N-Acetylcysteine, vitamin C and vitamin E diminish homocysteine thiolactone-induced apoptosis in human promyeloid HL-60 cells. J Nutr. 2002;132(8):2151–6. Available from: https://doi.org/10.1093/jn/132.8.2151.
|
| 57. |
Niki E. Interaction of ascorbate and alpha-tocopherol. Ann N Y Acad Sci. 1987;498:186–99. Available from: https://doi.org/10.1111/j.1749-6632.1987.tb23761.x.
|
| 58. |
Claro LM, Leonart MSS, Comar SR, do Nascimento AJ. Effect of vitamins C and E on oxidative processes in human erythrocytes. Cell Biochem Funct. 2006;24(6):531–5. Available from: https://doi.org/10.1002/cbf.1255.
|
| 59. |
Sakarya M, Eris FO, Derbent AB, Koca U, TÜZÜN S, Onat T, Veral A, Moral AR. The antioxidant effects of vitamin C and vitamin E on oxidative stress. Clin Intensive Care. 1999;10(6):245–50. Available from: https://doi.org/10.3109/tcic.10.6.245.250.
|
| 60. |
Taylor MB, Christian KG, Patel N, Churchwell KB. Methemoglobinemia: Toxicity of inhaled nitric oxide therapy. Pediatr Crit Care Med. 2001;2(1):99–101. Available from: https://journals.lww.com/pccmjournal/fulltext/2001/01000/methemoglobinemia__toxicity_of_inhaled_nitric.19.aspx.
|
| 61. |
Wright RO, Woolf AD, Shannon MW, Magnani B. N‐acetylcysteine reduces methemoglobin in an in‐vitro model of glucose‐6‐phosphate dehydrogenase deficiency. Acad Emerg Med. 1998;5(3):225–9. Available from: https://doi.org/10.1111/j.1553-2712.1998.tb02617.x.
|
| 62. |
Dumaswala UJ, Zhuo L, Mahajan S, Nair PN, Shertzer HG, Dibello P, Jacobsen DW. Glutathione protects chemokine-scavenging and antioxidative defense functions in human RBCs. Am J Physiol. 2001;280(4):C867–73. Available from: https://doi.org/10.1152/ajpcell.2001.280.4.C867.
|
| 63. |
Samuni Y, Goldstein S, Dean OM, Berk M. The chemistry and biological activities of N-acetylcysteine. Biochim Biophys Acta. 2013;1830(8):4117–29. Available from: https://doi.org/10.1016/j.bbagen.2013.04.016.
|
| 64. |
Banaclocha MM, Hernandez AI, Martınez N, Ferrandiz ML. N-acetylcysteine protects against age-related increase in oxidized proteins in mouse synaptic mitochondria. Brain Res. 1997;762(1-2):256–8. Available from: https://doi.org/10.1016/S0006-8993(97)00493-9.
|
| 65. |
Pallotta V, Gevi F, D’Alessandro A, Zolla L. Storing red blood cells with vitamin C and N-acetylcysteine prevents oxidative stress-related lesions: a metabolomics overview. Blood Transfus. 2014;12(3):376–87. Available from: https://doi.org/10.2450/2014.0266-13.
|
| 66. |
Rushworth GF, Megson IL. Existing and potential therapeutic uses for N-acetylcysteine: the need for conversion to intracellular glutathione for antioxidant benefits. Pharmacol Ther. 2014;141(2):150–9. Available from: https://doi.org/10.1016/j.pharmthera.2013.09.006.
|
| 67. |
Grinberg L, Fibach E, Amer J, Atlas D. N-acetylcysteine amide, a novel cell-permeating thiol, restores cellular glutathione and protects human red blood cells from oxidative stress. Free Radic Biol Med. 2005;38(1):136–45. Available from: https://doi.org/10.1016/j.freeradbiomed.2004.09.025.
|
