


An echocardiographic tool for the interatrial conduction disorders – old dog, new tricks?


Abstract
Background: Bachmann’s bundle plays a crucial role in the physiology of interatrial signal conduction. In the 1970s, Bayes de Luna introduced the definition of interatrial blocks (IABs), which negatively influence atrioventricular (AV) synchrony and left atrial (LA) activation. We aimed to assess the potential of LA strain technology in evaluating the mechanics of LA in patients with correct conduction and IABs. Additionally, we measured the parameters of regurgitation in pulmonary veins (PV), which depend on the type of interatrial conduction.
Material and methods: The study group comprised 51 patients (26 male, 25 female) with symptomatic COVID-19 and sinus rhythm. Our study analyzed their medical history, electrocardiography (ECG) and echocardiography, including the LA strain parameters.
Results: Global peak atrial longitudinal strain (PALS) depended on P-wave duration, LA volume, left ventricular ejection fraction (LVEF) and inferior pulmonary veins (PV) regurgitation parameters. Global peak atrial contractile strain (PACS) statistically depends on the LVEF, LA volume and the P-wave morphology.
Conclusions: The presence of IABs negatively influences PACS and PALS. Examining LA strain is complementary to accurate ECG, which may be helpful in everyday clinical practice, particularly in diagnosing heart failure with preserved ejection fraction (HFpEF) and as a predictor of new episodes of atrial fibrillation (AF).
Citation
Zawadzki J, Gajek J, Sławuta A, Kozłowski D, Zaborniak G, Kudliński B. An echocardiographic tool for the interatrial conduction disorders – old dog, new tricks?. Eur J Transl Clin Med. 2023;6(2):26-35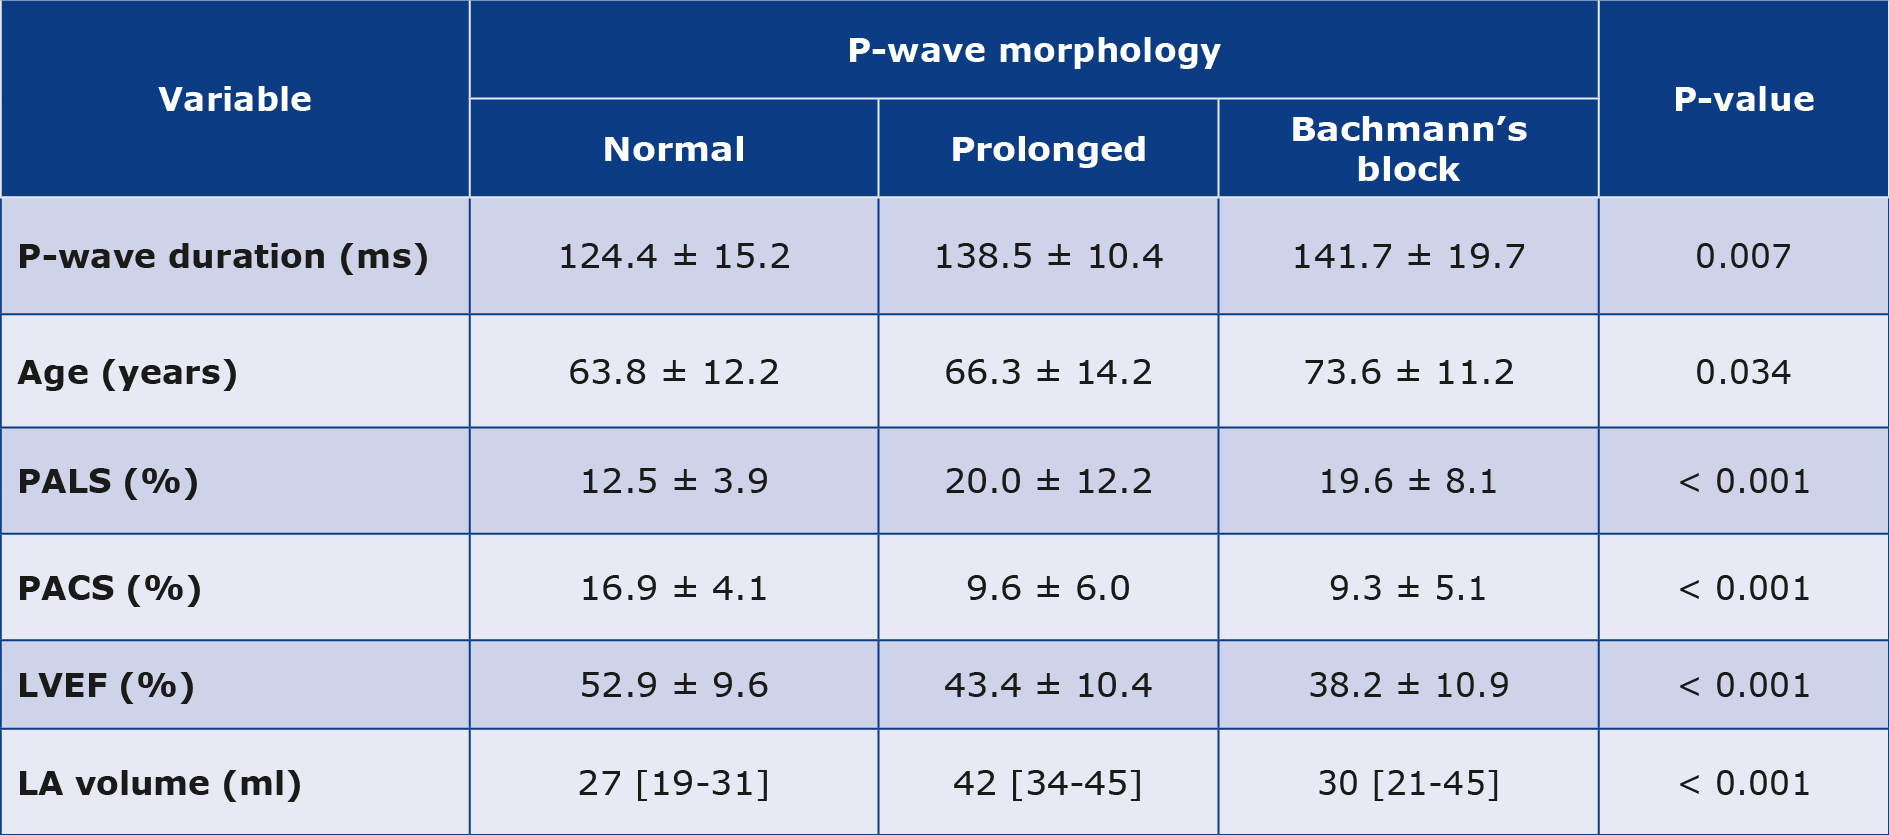


Introduction
The activation of atria physiologically starts from the sinus node, then spreads across the right atrium (RA) and simultaneously turns to the left atrium (LA) [1]. Bachmann’s bundle plays a crucial role in the interatrial conduction because it is the only physiological pathway of the impulse to the LA [2]. The correct LA activation is directly connected with its correct contraction profile, i.e. mechanical function. This fact is also of great importance in the efficient filling of LV [3]. When the atrium contracts, some blood volume naturally flows back into the pulmonary veins (PV) without valves as they enter LA. The natural way of reducing that regurgitant flow is the activity of the circular fibers around the PV inlets which clench with LA contraction, thus reducing their diameter [4]. The other significant problem is the impairment of atrioventricular synchrony, which may result in developing heart failure (HF), usually with preserved ejection fraction (HFpEF) [5]. This issue touches mainly the LV due to the higher pressure necessary for efficient filling [6]. In this regard, the most dangerous subtype of the IABs should be the advanced interatrial conduction block (A-IAB). Typically, in this case, the roof of the LA is blocked for the approaching impulses [7]. This means the impulses spread through alternative pathways that are also visible in the ECG recording (Figure 1-2). Our goal was to assess the potential of LA strain technology in evaluating the mechanics of the LA in patients with correct conduction and IABs. Additionally, we measured the parameters of PV, which depend on the type of interatrial conduction.
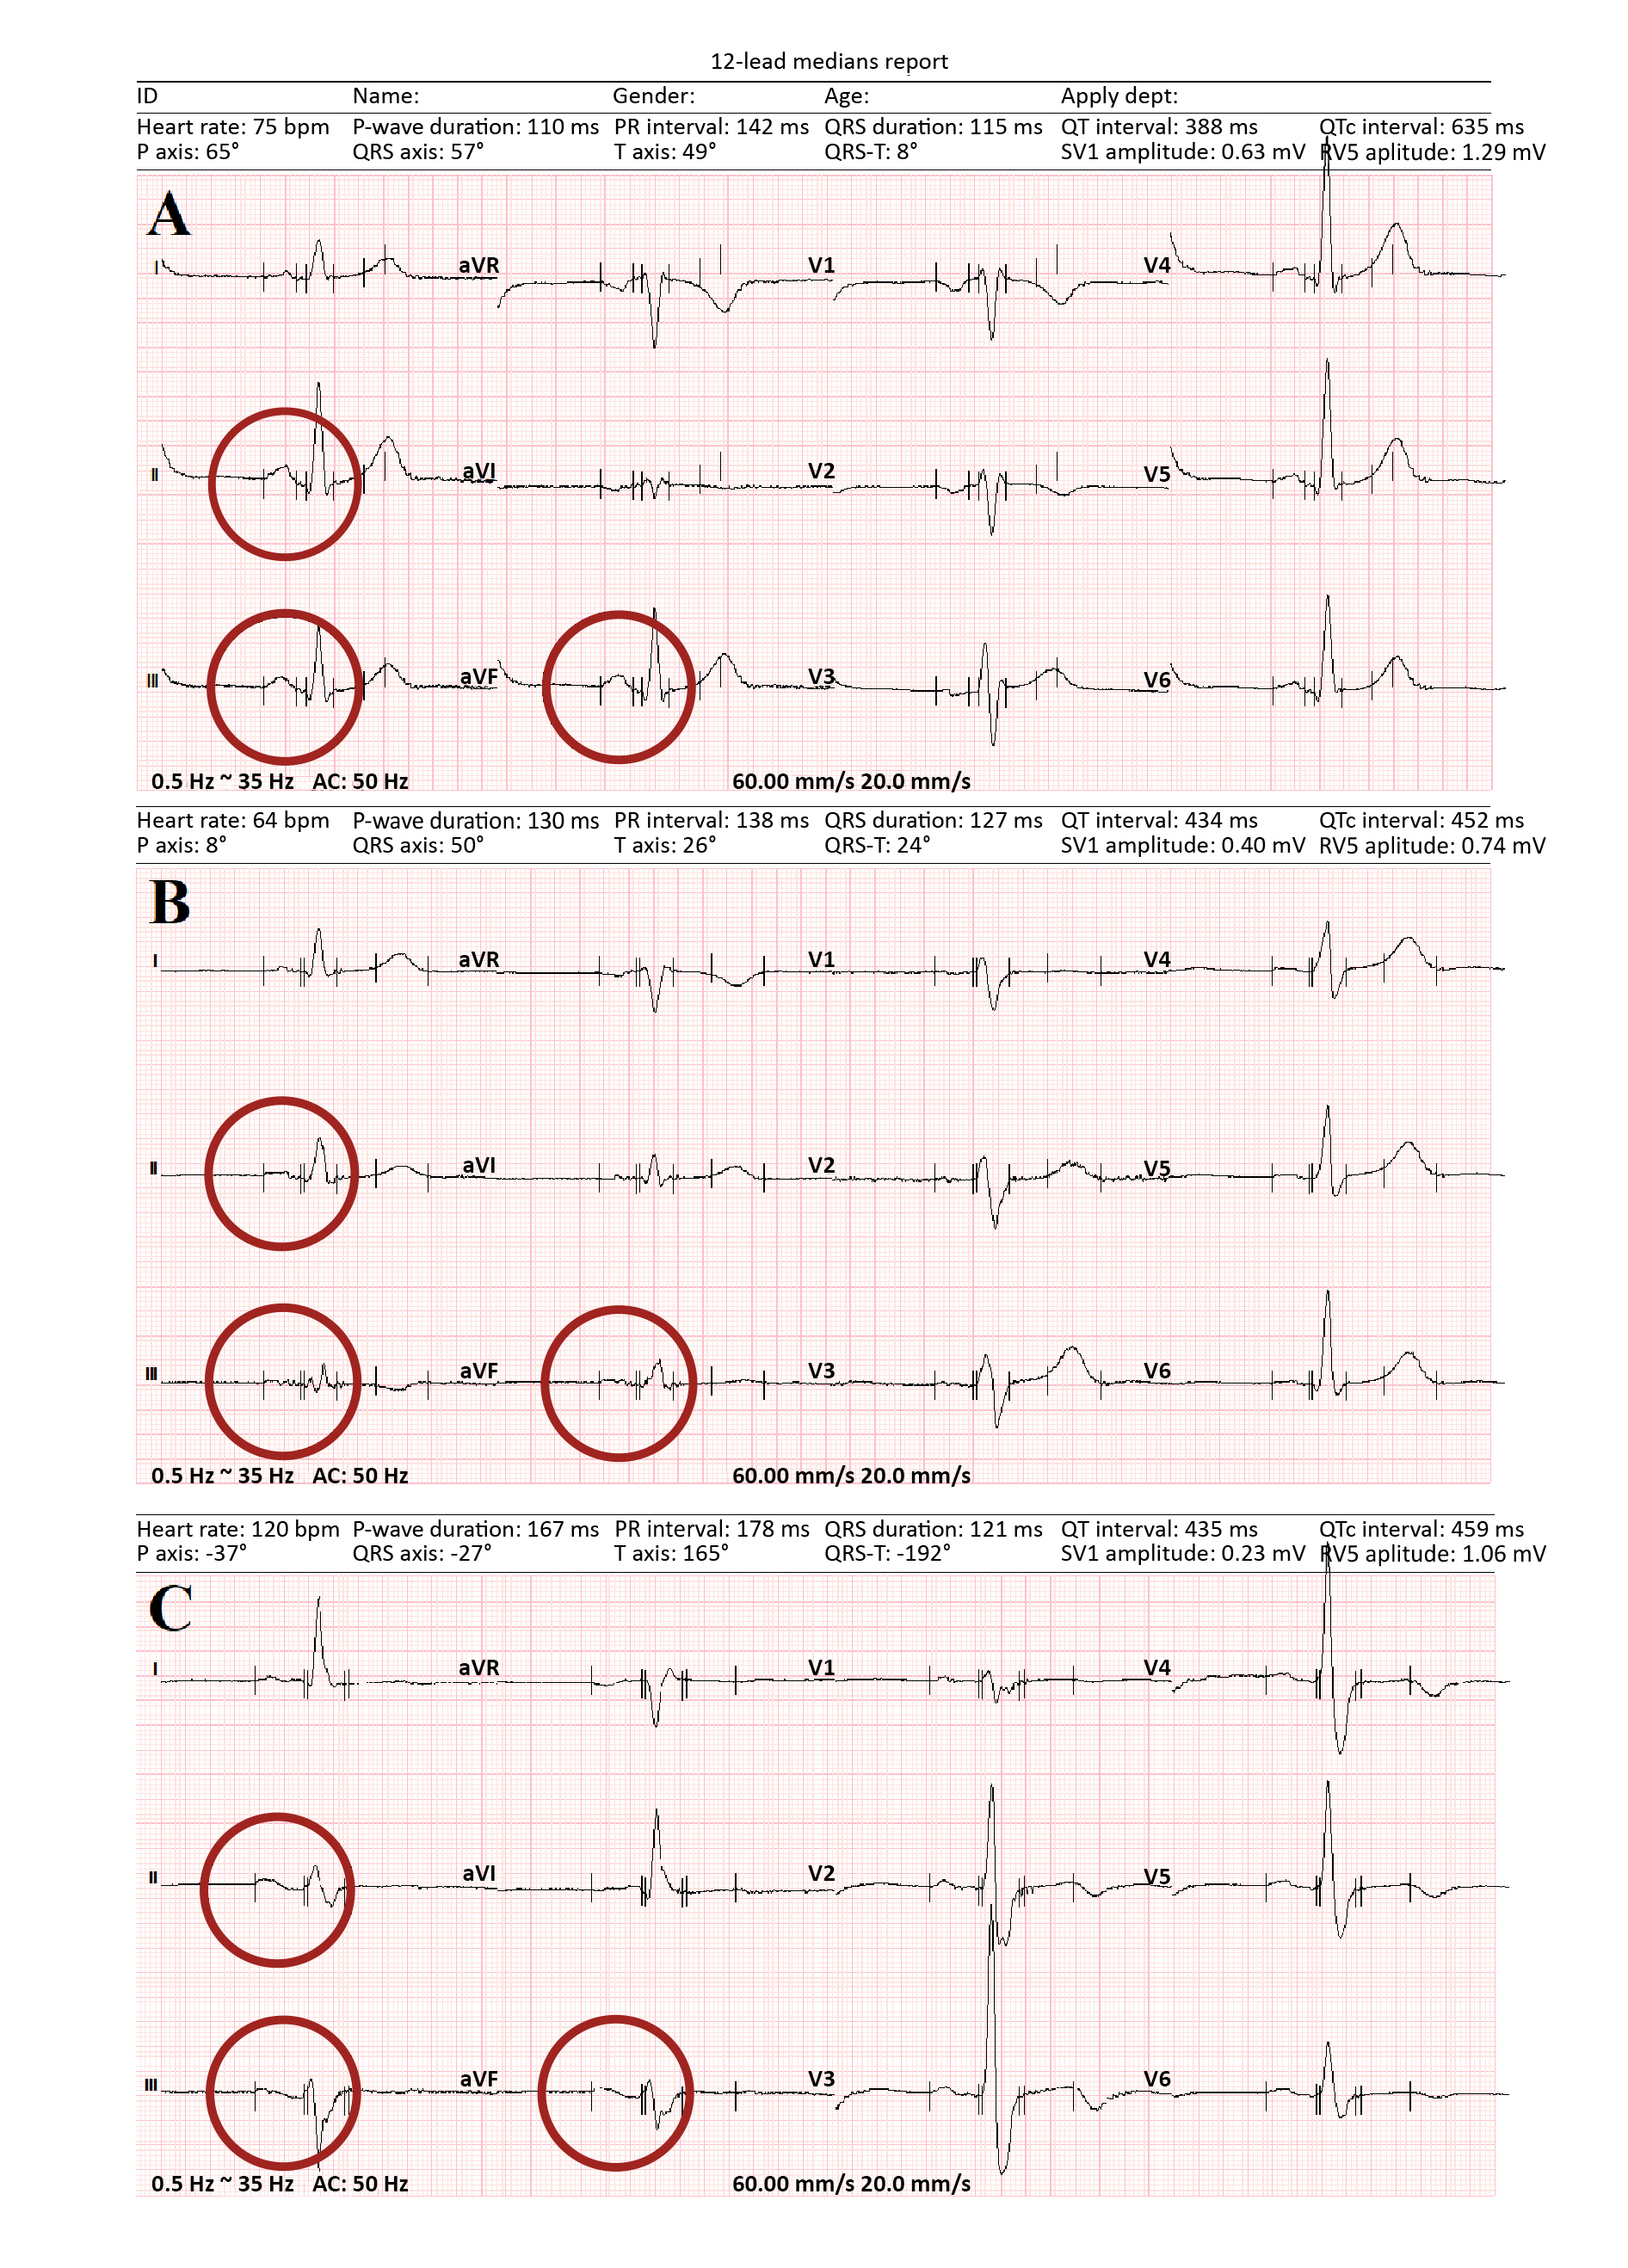
Figure 1. ECG recordings showing different P-wave morphologies
A – normal P-wave morphology; B – prolonged P-wave; C – the full Bachmann’s bundle block reflected by positive/negative P-wave morphology. The recording was done by the means of raster graphics, with the following parameters: 60 mm/s and 20 mm/mV.
Figure 2. The same ECG recordings as in Figure 1 registered using fully scalable vector graphics. The accuracy of measurements is significantly higher than in Figure 1.
Material and methods
Our study group consisted of 51 unselected patients (26 male, 25 female) hospitalized due to COVID-19 in the University Hospital in Zielona Góra. The inclusion criterion for the study group was the presence of sinus rhythm at the moment of examination. In contrast, the exclusion criteria were: presence of any other rhythm, valvular heart disease, eGFR < 30 ml/min/1.73 m2, malignant tumor, decreased hemoglobin level (< 11 mg/dL), autoimmune disease and thyroid disease. We assessed each patient’s history, laboratory tests, electrocardiography (ECG) and echocardiography. The used the Tele ECG device (Biomedical Instruments Co., Ltd., Shenzhen, China) to record 12-lead ECGs at the paper speed of 200 mm/s, with an enhancement x256. Full-size vector graphics of the ECG recordings were used during the interpretation. The IABs were divided as suggested by Bayes de Luna: by the specific morphology of the P-wave in leads II, III and aVF (Figure 1) [8-9]. The first group of patients (Group 1) had ECG recordings with regular and positive P-waves, with < 120 ms duration or the amplitude > 0,1 mV [10]. Group 2 had ECGs with prolonged and flattened P-waves, which seems to be typical for atria with damaged structure e.g. due to fibrotic changes. Group 3 had ECGs with positive/negative P-wave morphology. In groups 2 and 3 the duration of P-waves was > 120 ms.
We used the Arietta 65 ultrasound system (FujiFilm Corporation, Tokyo, Japan) to assess the LA volume, left ventricular ejection fraction (LVEF), mitral regurgitation (MR) and PALS in different phases. In addition, we evaluated the speed and pressure of the regurgitant flow through the PV.
We conducted the study from September 2021 to March 2022 and it was approved by the local Bioethical Committee in Zielona Góra (Number 17/153/2021).
Statistical analysis
The study depicted patient characteristics through box and mean plots, while the relationships between variables were illustrated in scatter plots with regression curves and confidence intervals. The quantitative analysis involved a regression model, Pearson’s correlation coefficient, Fisher’s exact test and Student’s t-test for group mean comparisons. Additionally, relationships between variables were validated using the analysis of covariance.
Results
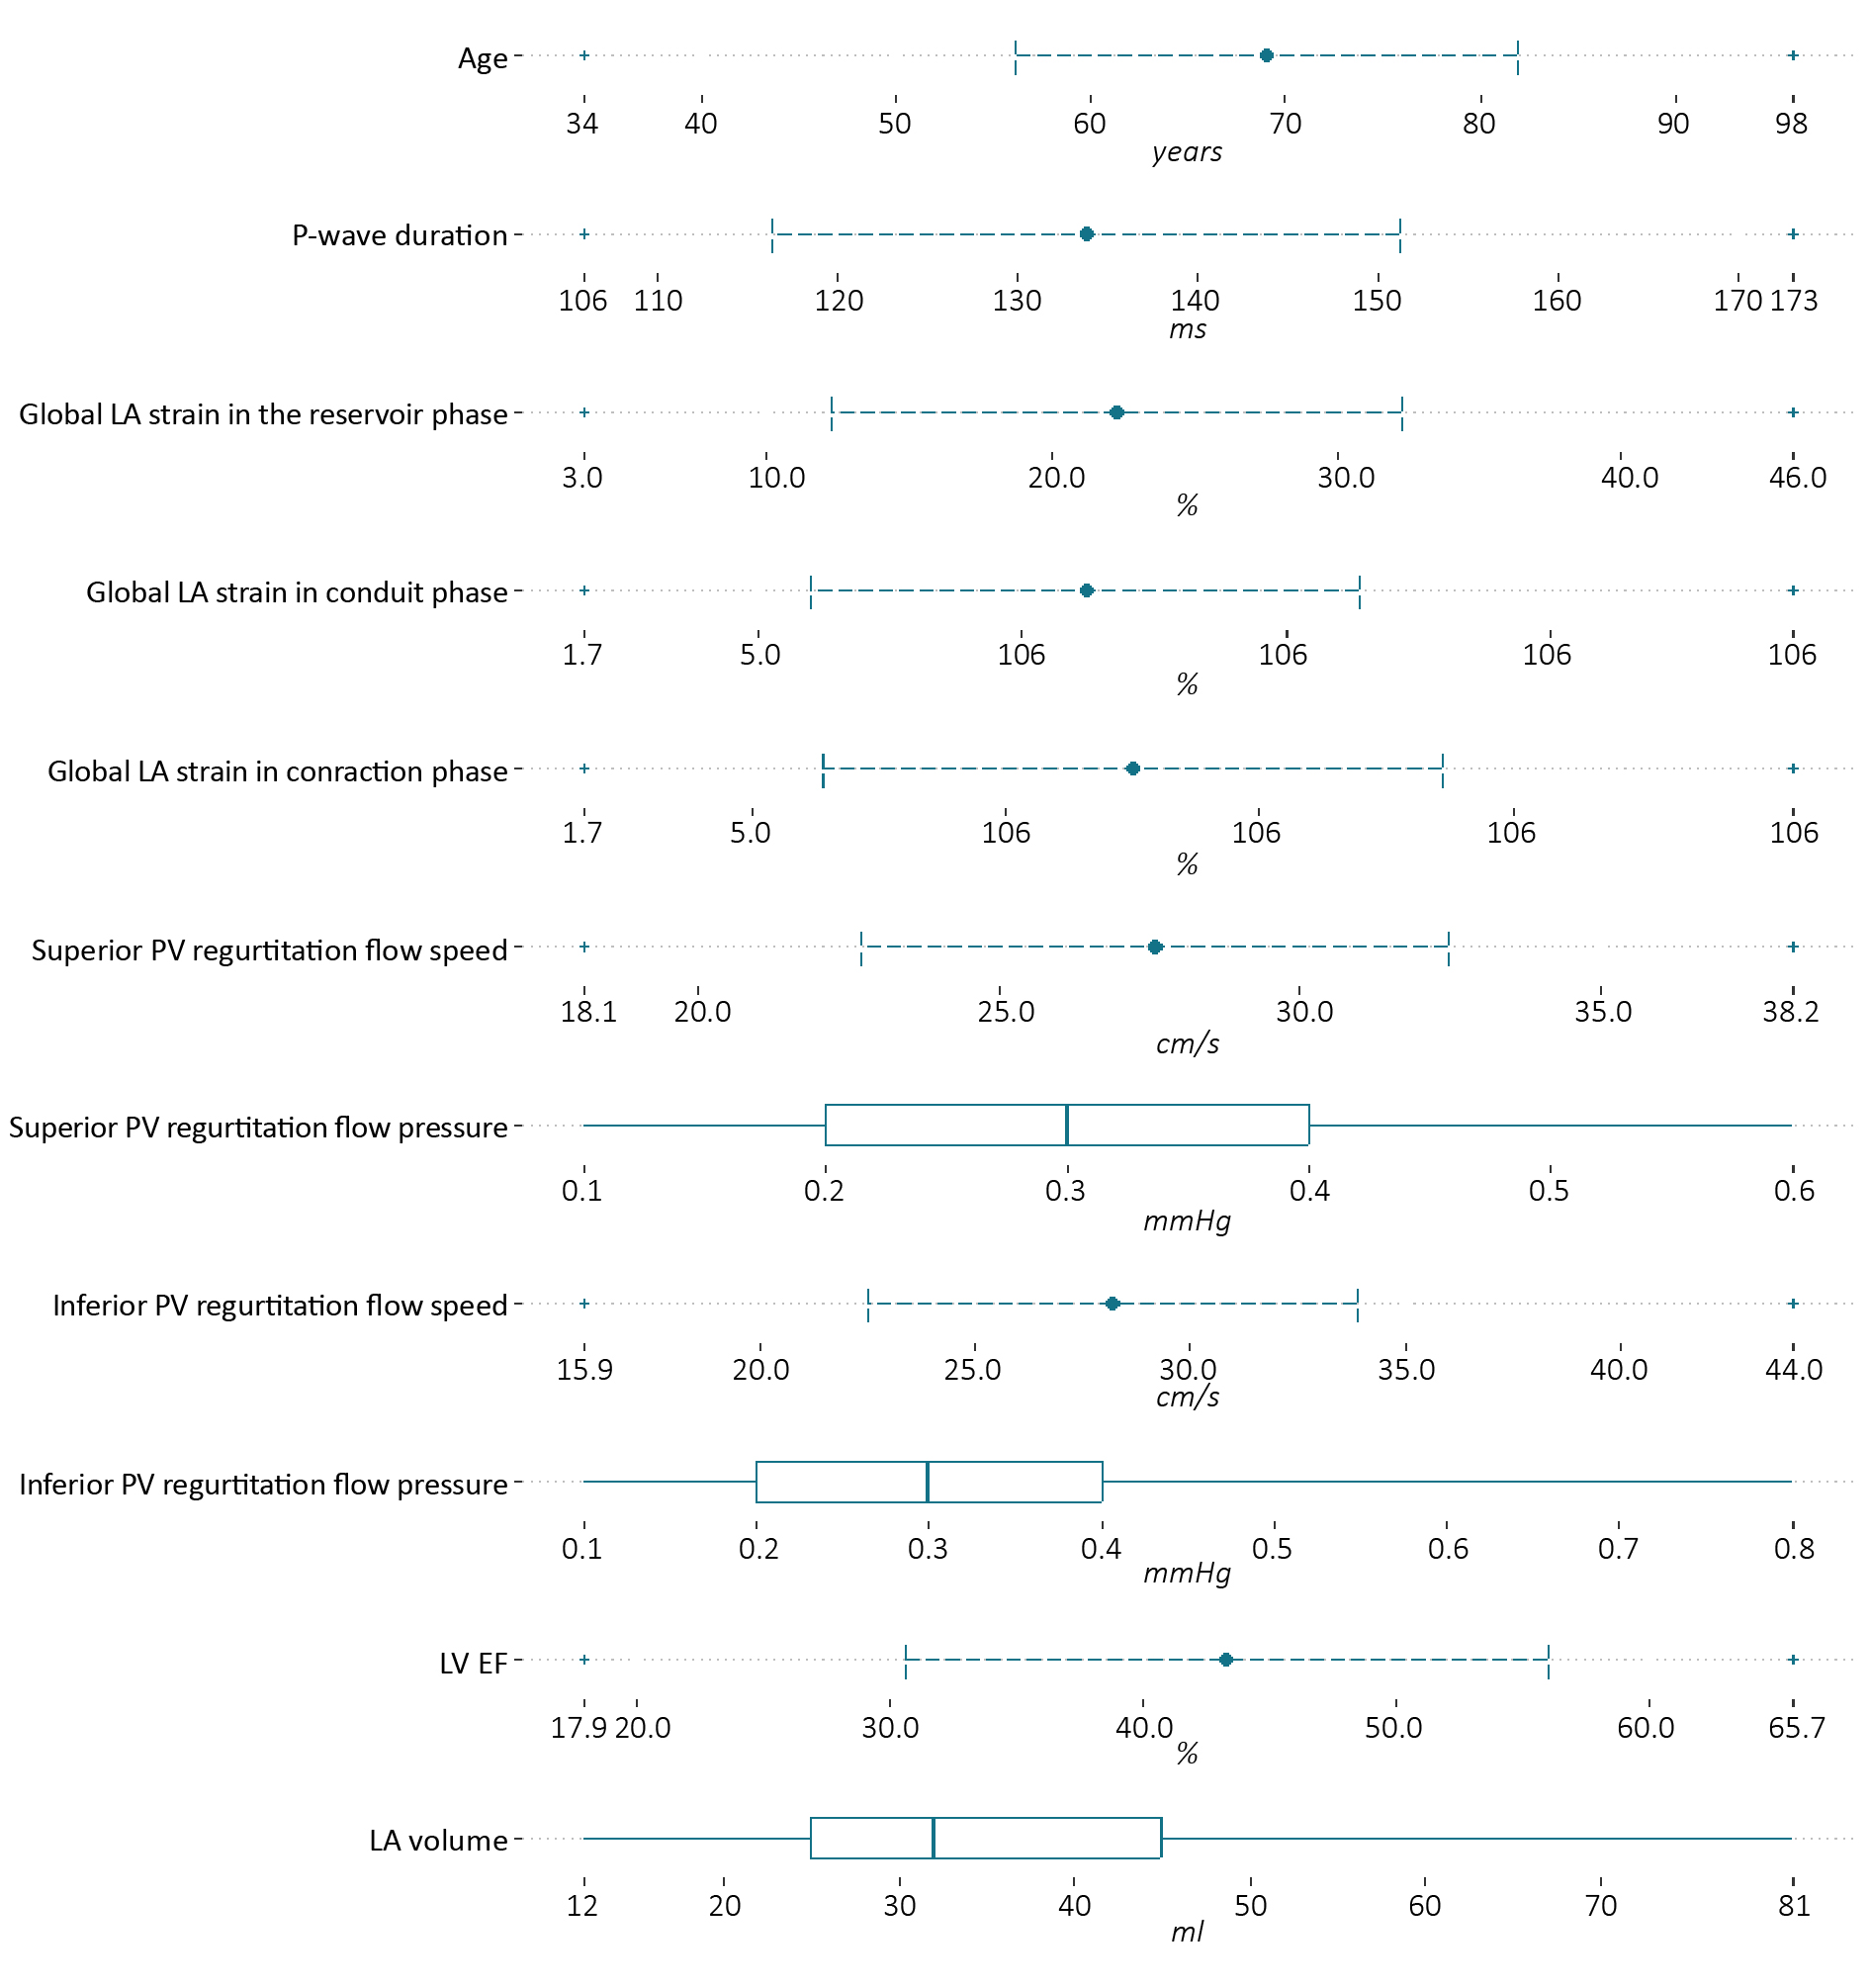
The baseline characteristics of the patients who qualified for our study group are presented in Figure 3. Among most common comorbidities were: arterial hypertension (n = 36; 70.6%), diabetes mellitus 2 (n = 21; 41.2%), heart failure (n = 12; 23.5%), ischemic heart disease (n = 12; 23.5%), paroxysmal atrial fibrillation (n = 11; 21.6%), chronic obstructive pulmonary disease (n = 7; 13.7%), obesity (n = 5; 9.8%), asthma (n = 3; 5.9%), chronic kidney disease (n = 2; 3.9%).
Figure. 3 The baseline characteristics of patients included in the study
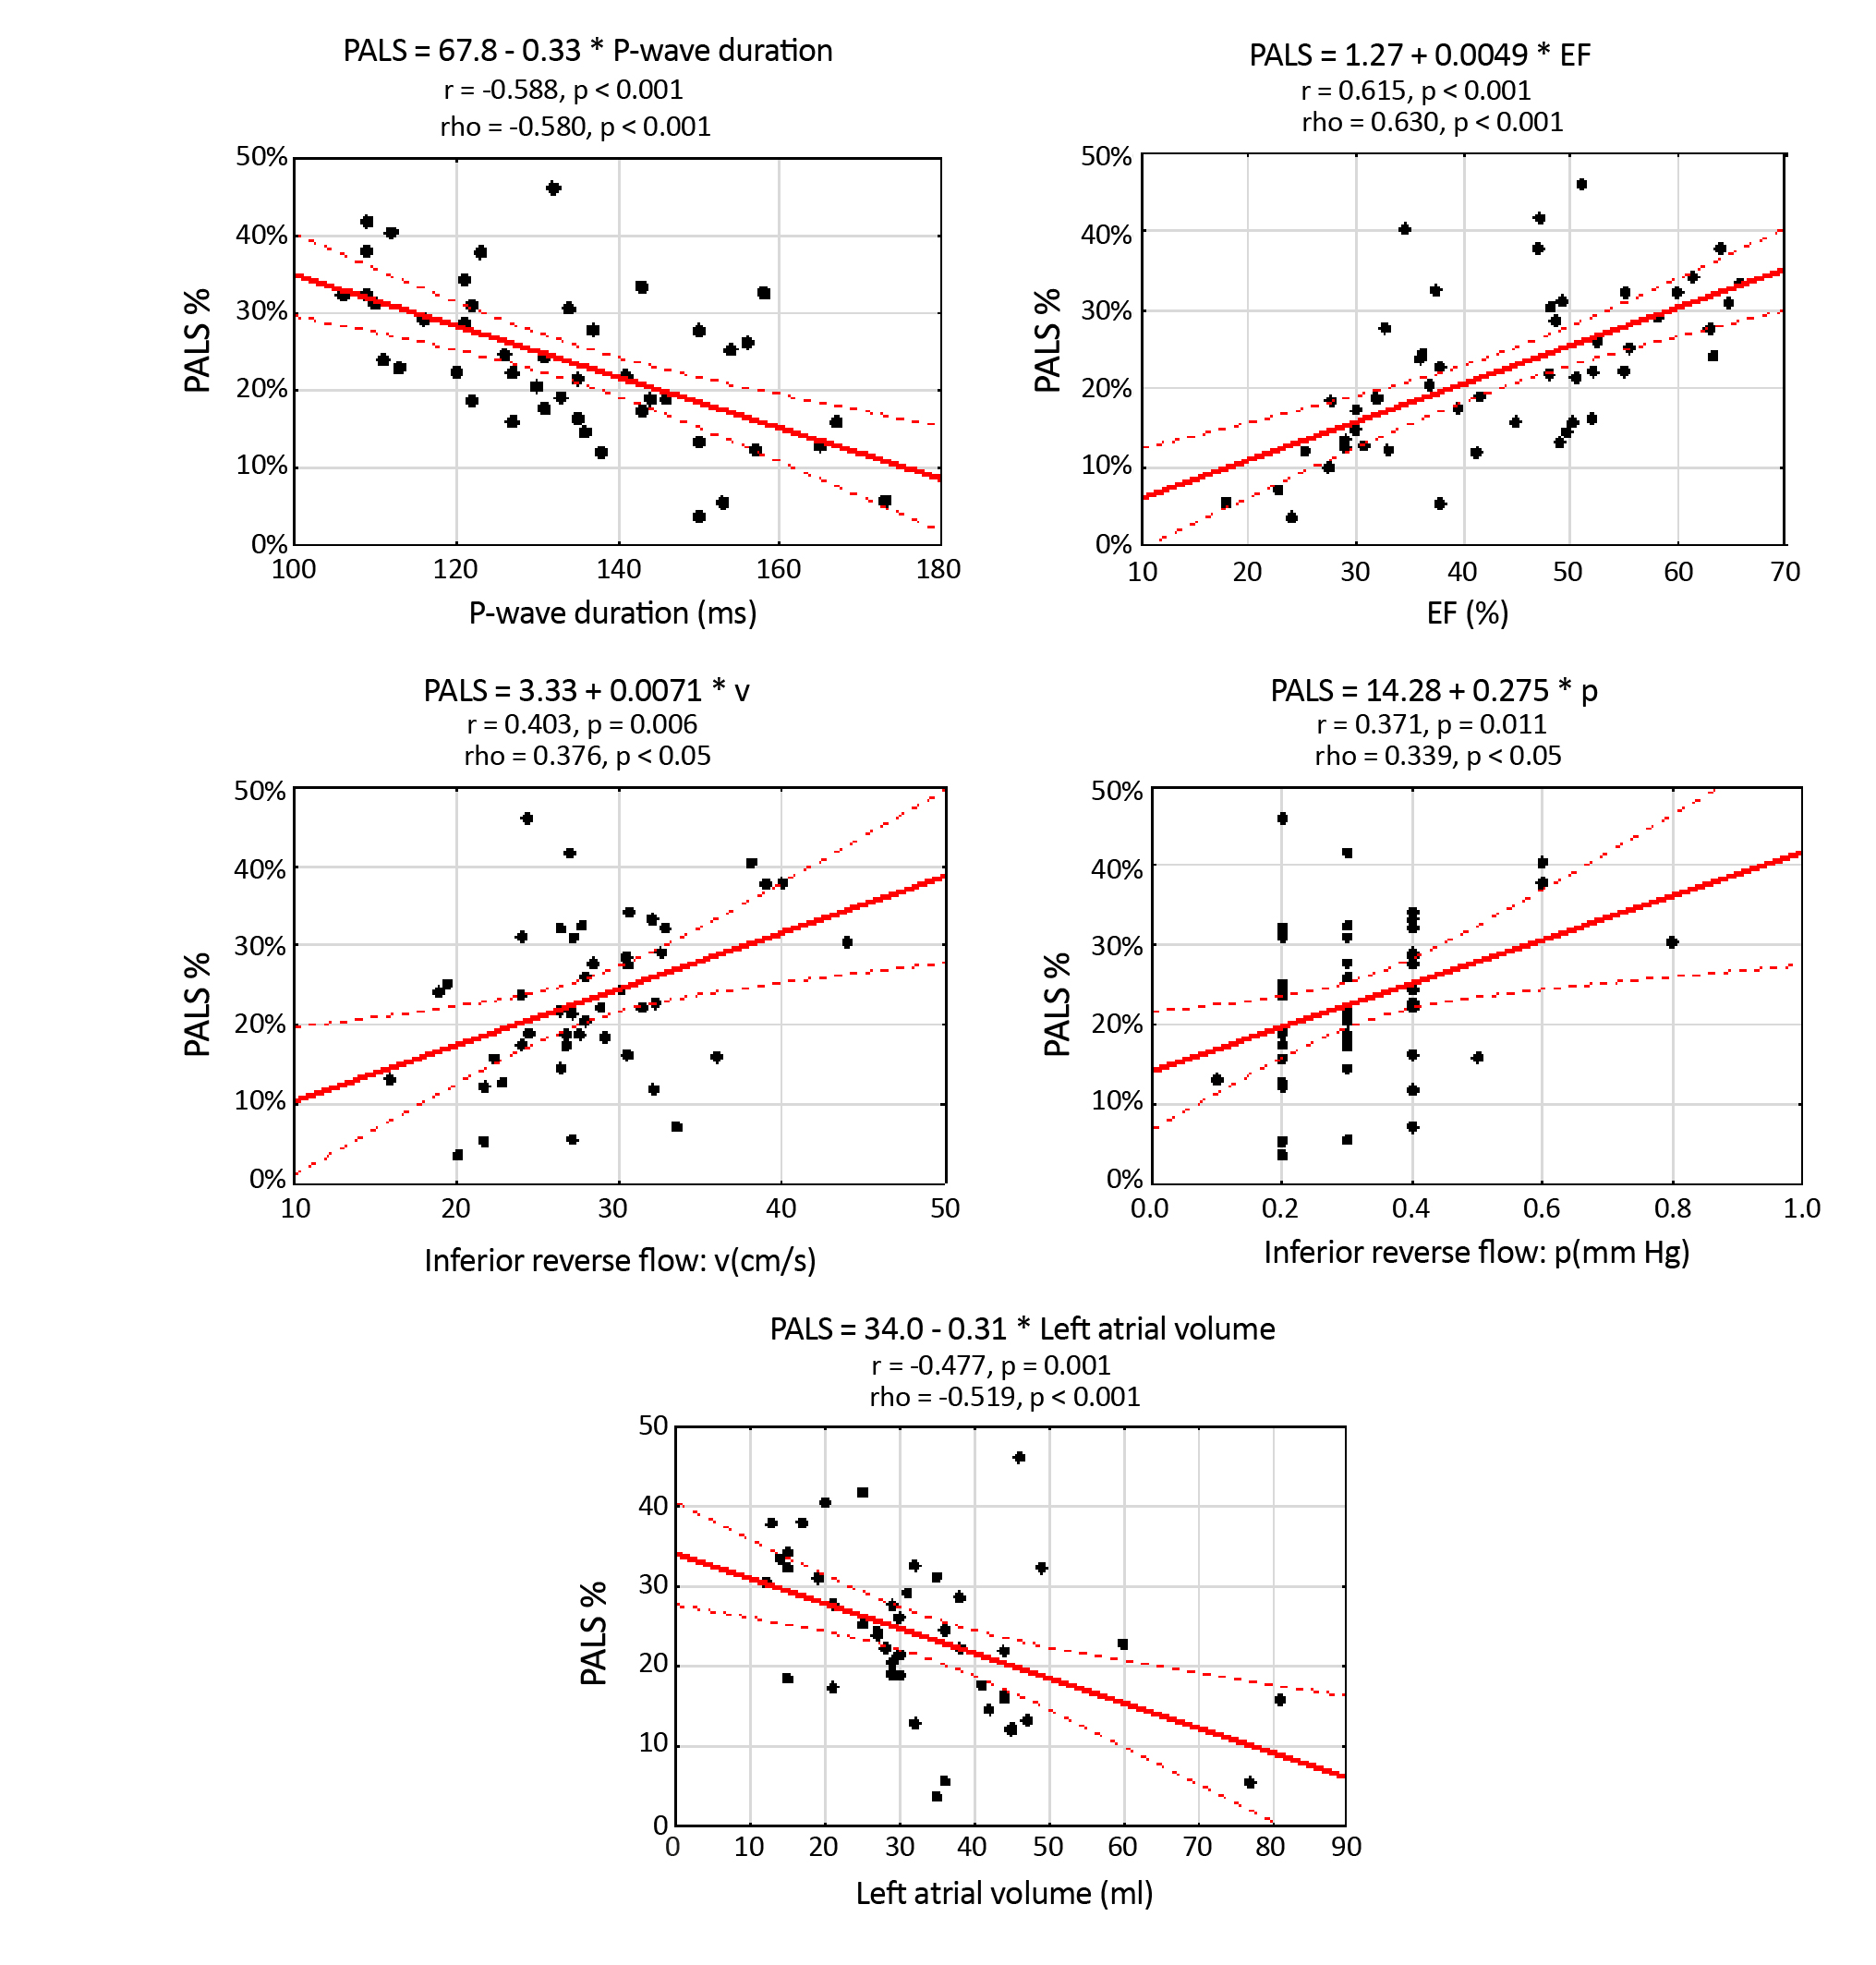
The statistically significant data in Table 1 are divided into groups depending on the P-wave morphology. There was a statistically significant correlation between age, LV ejection fraction, LA volume, PALS, PACS and the P-wave morphology. The rest of the data and correlations are presented in Figure 4. Statistical significance exists between PALS and the inferior PV regurgitation flow parameters. LV ejection fraction and LA volume are also directly dependent on PALS.
Table 1. Statistical significance of patients’ characteristics depends on the P-wave morphology
Figure 4. Graphs of PALS scattering depend on the P-wave duration, LVEF, velocity and pressure in the regurgitant flow in the inferior pulmonary veins (Pearson’s correlation coefficients and the simple regression analysis)
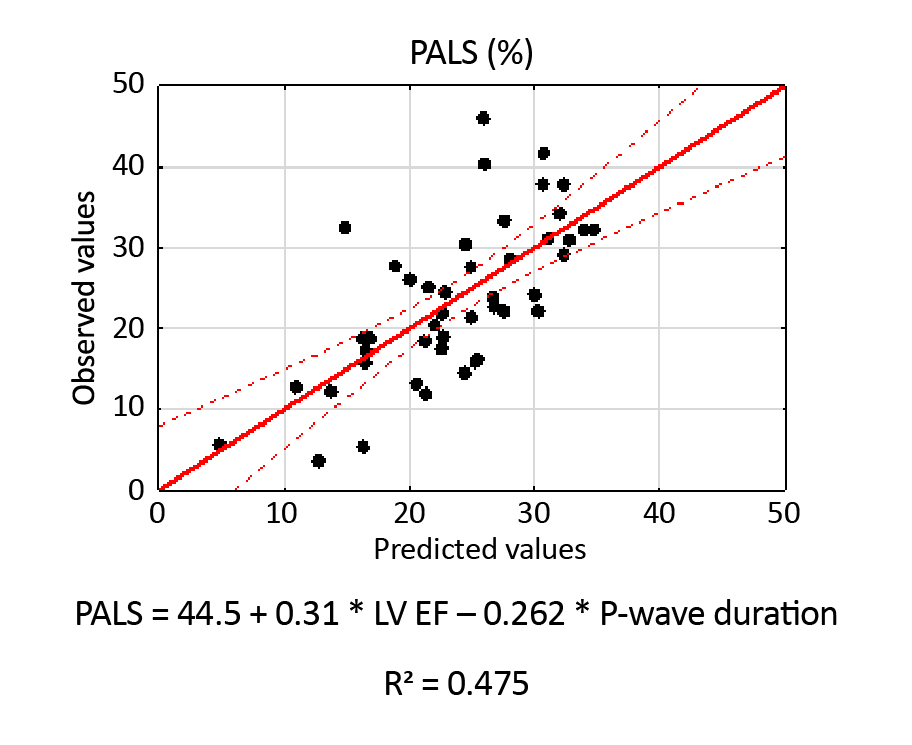
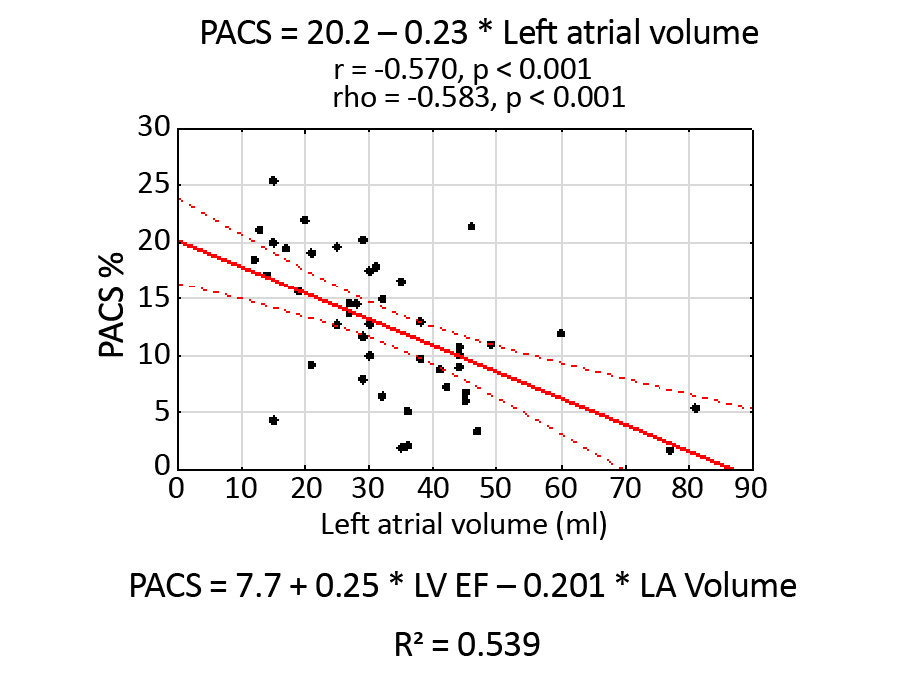
Figure 5 shows the Scatterplot of observed PALS values against the predicted values based on all independent parameters that are statistically significant. The scatterplot indicates a sufficiently good fit of the model to the measured values. Similarly, Figure 6 shows the PACS scatterplot, independently correlated with LA volume.
Figure 5. Scatterplot of observed PALS values against the predicted values
Figure 6. Scatterplot of PACS values against the LA volume
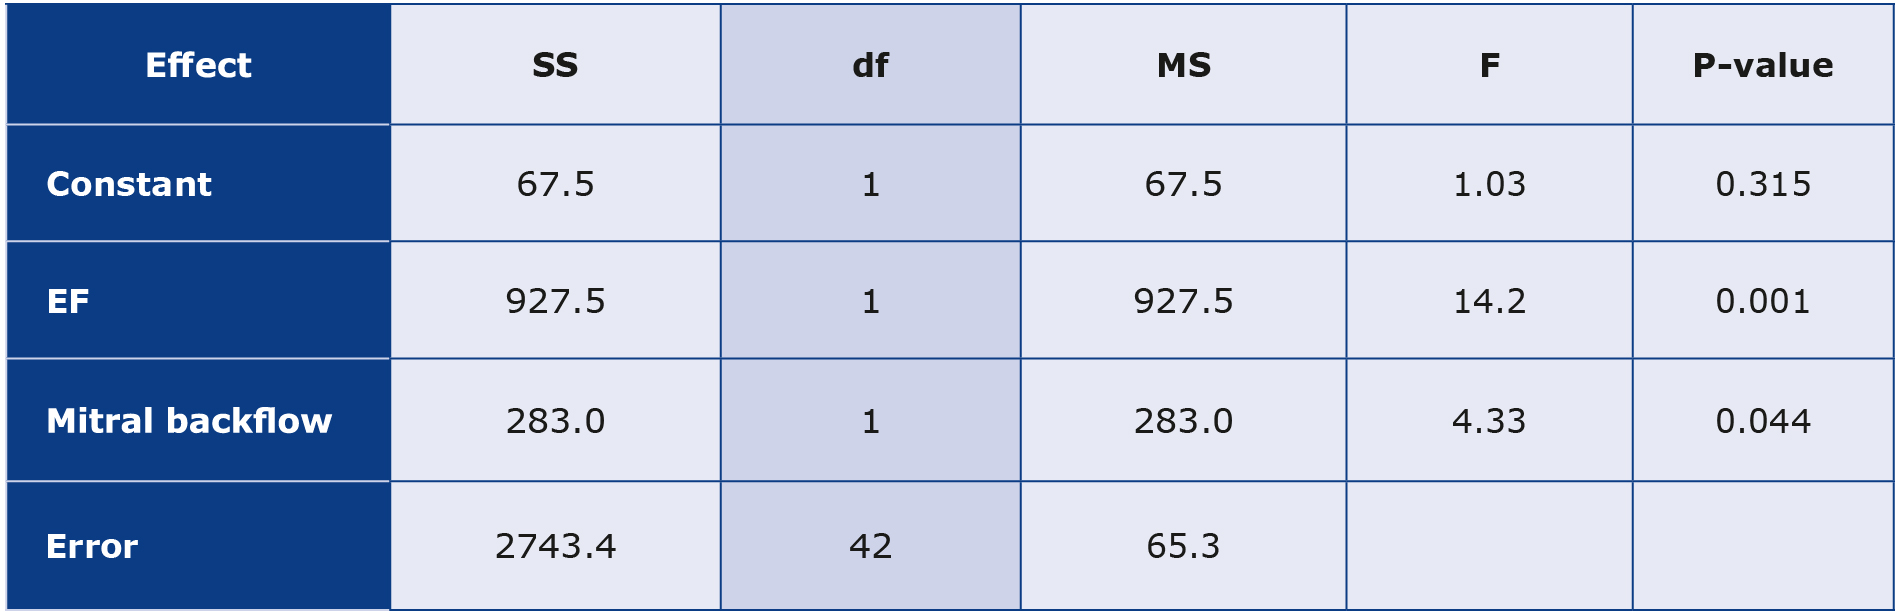
An analysis of covariance, which was done based on nominal variables and quantitative variables in the presence of confounding variables, was another approach that shows exciting trends. We treated PALS as a dependent variable, while the presence of mitral regurgitation was an independent variable and LVEF was the confounding value. The results are presented in Table 2.
Table 2. The results of an analysis of covariance for PALS
Df – degrees of freedom (represent the number of independent values or observations available for estimating parameters or testing hypotheses; F – F-statistic (the ratio of variances used to test the hypothesis of equality among group means); MS – mean square (obtained by dividing the sum of squares by its corresponding degrees of freedom; p-value (indicates the probability of obtaining the observed F-statistic or a more extreme value if the null hypothesis is true); SS – sum of squares (represents the variability in the data)
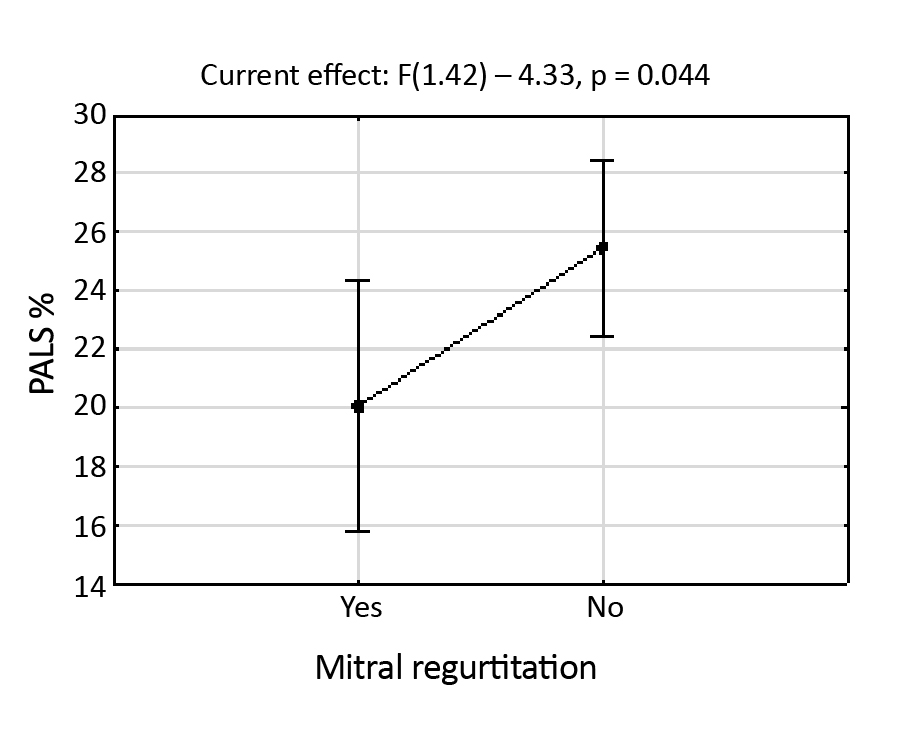
Based on Table 2, we state that at the p = 0.001 level, the null hypothesis (no significant effect of the LVEF variable on the PALS variable) should be rejected. In other words, the LVEF variable significantly affects the PALS variable. At the significance level of p = 0.044, the second null hypothesis (no effect of mitral regurgitation on PALS) should be rejected. Therefore, PALS depends significantly on the presence or absence of the mitral reverse flow, as supported by Figure 7.
Figure 7. The graphic presentation of the results acquired from the analysis of covariance
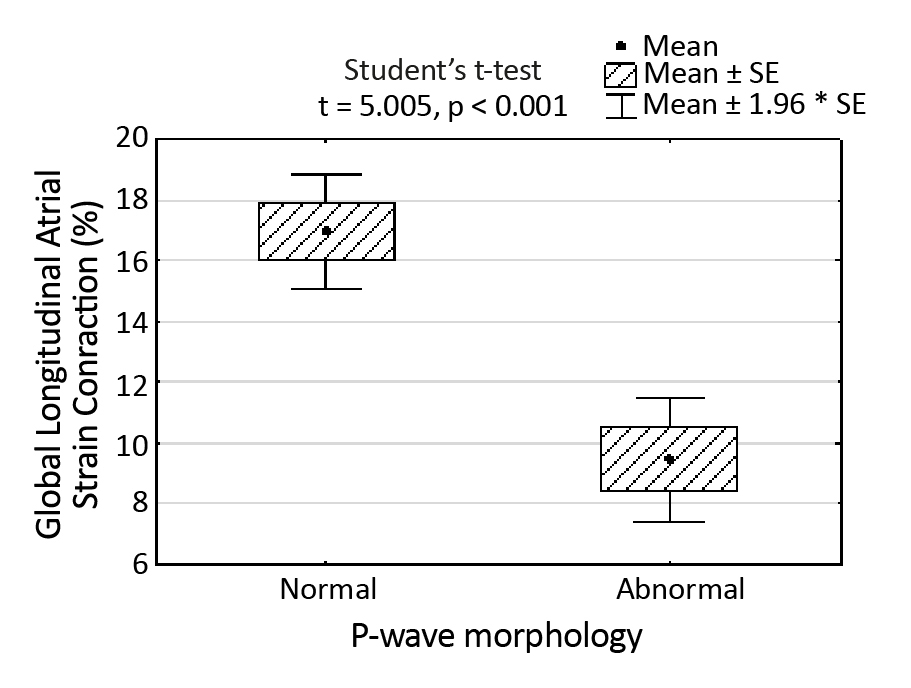
Figure 8. Correlation between PALS and the morphology of the P-wave regarding whether it is normal or abnormal
Based on the presented results, we state that PALS is related to P-wave duration, LVEF and mitral reverse flow. Interestingly, PACS seems to depend on the P-waves’ morphology (Figure 8).
Abnormal P-wave indicated the presence of an A-IAB (advanced interatrial conduction block) or a P-IAB (partial interatrial conduction block). In the investigation of the correlation between hypertension and left atrial parameters (PALS and PACS), two-sample t-tests were employed. For PALS, the test yielded a non-significant result (t = 0.39403; P-value = 0.6955), suggesting a statistically not significant difference in the mean between groups with and without hypertension. Similarly, for PACS the t-test result (t = -0.90182; P-value = 0.3722) supports the absence of a significant difference in means between the two groups. Additionally, Fisher’s exact test indicated a significant association between hypertension and interatrial block (IAB) (P-value = 0.04098, odds ratio = 4.43, 95% CI:0.93-25.13), highlighting a statistically relevant relationship, suggesting that individuals with hypertension are approximately 4.43 times more likely to have experienced an interatrial block (IAB).
Discussion
The critical material of our discussion should be focused on the fact that speckle tracking (LA strain) technology is complementary to accurate electrocardiographic assessment, which we proved in our research. Moreover, our results support the thesis that interatrial blocks affect interatrial synchrony and influence the mechanic synchrony of LA contraction.
Among the most critical correlations in our study, the parameters are directly dependent on the P-wave morphology (Table 1). P-wave morphology and LA volume (Figure 4) correlated with PALS. PALS is measured in LA early diastole, meaning that the diastolic function is worse in case of abnormal P-wave morphology. It is well-known that the structurally damaged atrium has poor signal conduction, resulting in altered P-wave morphology and a poor diastolic function. This correlation corresponds to the observations made by Kosmaa in his research published in 2020 [11]. The authors measured PALS, PACS and LA volume index (LAVI), which turned out to be the most predictive parameters for AF in the future. It was stated that the higher risk for AF was mainly connected to the lower LA strain values. The study was very interesting, showing the potential of echocardiographic tools. However, the authors didn’t touch on the meaning of the P-wave morphologies, which prompted us to conduct our research.
The P-wave morphology is very important in this matter, as Bayes de Luna stated in his definition of “Bayes Syndrome” [12-13]. The point was that the presence of A-IAB is a strong predictor for new episodes of AF in patients with heart failure.
In our study, PALS and PACS correlated with the P-wave morphology, proving that the decreased atrial contraction is connected to the abnormal P-wave morphology. It should be remembered that the differences between PALS and PACS versus P-wave morphology was significant only between normal and abnormal P-wave morphologies, i.e. normal P-wave versus any IAB (Figure 8). This tendency requires further research by quantitative LA regional strain.
Watanabe was close to this idea by presenting an exciting approach using the phenomenon of LA mechanic dispersion in his study in 2015 [14]. This term was defined as the SD of the time to the top of the regional strain curves. The measurements were corrected by RR interval. LA mechanical dispersion was supposed to determine the alterations in synchrony of LA contraction; however, similarly to Kosmala, the research did not mention the morphology of the P-wave and did not directly measure the order of the separate LA regions’ contraction. This combined, complicated approach remains an open question for future research.
One of our aims was to examine the correlation between LA functional parameters and the parameters of PV regurgitant flow. Figure 4 shows there was a strong statistical dependence between PALS and the velocity and pressure in the inferior PV. Unfortunately, we haven’t found any literature touching this problem, which makes our findings novel in this field and requires more detailed research. There was also another potential relation, which we had to analyze to remain as objective as possible: the connection between mitral regurgitation and the regurgitant flow in PV. It turned out there was no significant correlation between these two variables. We found more elaborate explanations for this fact in research published by Mark et al. [15]. The authors stated: “(…) it is unlikely that mitral regurgitation jet direction per se causes predictable and selective unilateral alteration in pulmonary vein flow patterns.”
Focusing on PALS and PACS, we also defined the independent factors influencing these parameters. For example, as presented in Figure 5, PALS directly depends on LVEF and P-wave duration, with a sufficiently good coefficient R2. When it comes to the analysis of covariance, it turned out that the presence of mitral regurgitation also correlated with PALS independently. In his study, Stassen found that PALS was associated with the severity of mitral regurgitation, which directly supports our findings [16]. The authors focused on patients with more than mild (grade ≥ 2) secondary MR.
PACS was also dependent on the LVEF and the other significant parameter was LA volume with a sufficiently good coefficient R2. Most of the publications focus on the relationship between PALS and LV diastolic dysfunction in terms of HFpEF, which has been growing very popular. [17-19]. The reason for that is the assessment of LA enlargement, which is one of the diagnostic criteria in the definition of HF and LA strain turns out to be a promising new tool [20]. This means the discussion about PACS’s meaning in patients with HFpEF and HFrEF is still open and requires more attention.
The IABs
To understand the complete perspective, we should discuss the phenomenon of interatrial blocks. Bayes de Luna first described and introduced the definition of interatrial blocks (IABs) in his research in 1979 [7-8]. The slowdown of the signal characterizes the partial block (P-IAB) of the Bachmann’s bundle spread through the roof of the left atrium. It is problematic because the atria are physiologically connected by the Bachmann’s bundle, which blends in with the muscular tissue of LA in the region of the LA roof [21-22]. This kind of block is observed in ECG as aprolonged, often double-peaked P-wave [23]. The peaks depict the activation of RA and LA, respectively, which means there is a delay between these activations. It is also common that the P-wave is flat in the case of P-IAB. The reasons for the low amplitude of the P-wave in P-IAB are the structural damage of atrial muscular tissue or the presence of additional activation connected with many electric currents spreading across LA. The multiple currents act against each other, resulting in a flat resultant of the P-wave [24]. The optional breakthrough spot between LA and RA may be located in the foramen ovale or the coronary sinus [25].
In the case of A-IAB, the roof of LA is blocked, which means that the impulses spread anteriorly and inferiorly around the blocked roof. This activation profile is followed by the caudocranial activation of the LA roof and the area between PV [26]. In ECG, this phenomenon is reflected by positive/negative P-wave morphology. The positive component reflects the contraction of RA, while the negative part depicts the caudocranial activation of LA.
Interestingly, the optional, pathologic ways of conduction may be present in both P-IAB and A-IAB. An argument supporting this statement is the fact that only normal vs. abnormal P-wave morphology was statistically significant regarding LA contraction strain. The subtypes of IAB aren’t statistically significant between each other in this regard, according to the results of our research. The only important factor for PACS was the existence of any IAB (Figure 8). This fact requires further examination with an assessment of LA regional strain.
Clinical implications
Our findings may be clinically applied in improved diagnostics of the new onsets of AFP in the future. The decreased LA strain in connection with abnormal P-wave morphology is evidence of asynchronous LA contraction, which increases the likelihood of AF in the future. Also, the decreased function of LA may be a component of HFpEF development and diagnosis.
Study limitations
Among significant study limitations, we enumerate a relatively small study group and the lack of other literature that could serve as a reference or a comparison. The acquired values were difficult to interpret or discuss without additional scientific support. This fact, however, makes our study one of the first to discuss this topic. The other limitation was the presence of acute COVID-19, the main comorbidity among patients in our study. We are unaware of how it influenced the results. Some publications indicate that COVID-19 per se could negatively affect the conduction and development of IABs [27]. It also means that the infection could have a negative impact on LA strain values. In future research, we plan to confront these findings with patients without COVID-19.
Conclusions
The presence of IABs influences PACS and PALS negatively, i.e., the mechanic function of LA is decreased. PALS statistically correlates with the P-wave duration, LVEF, LA volume and mitral regurgitation. At the same time, PACS is statistically dependent on the LVEF, LA volume and the P-wave morphology. Examining LA strain is complementary to an accurate ECG interpretation, which may be helpful in everyday clinical practice.
Conflicts of interest
None to report.
Funding
Not applicable.
References
| 1. |
Ramanathan C, Jia P, Ghanem R, Ryu K, Rudy Y. Activation and repolarization of the normal human heart under complete physiological conditions. Proc Natl Acad Sci USA [Internet]. 2006;103(16):6309-14. Available from: http://www.ncbi.nlm.nih.gov/pubmed/16606830.
|
| 2. |
van Campenhout MJH, Yaksh A, Kik C, de Jaegere PP, Ho SY, Allessie MA, et al. Bachmann’s Bundle. Circ Arrhythmia Electrophysiol [Internet]. 2013;6(5):1041-6. Available from: https://www.ahajournals.org/doi/10.1161/CIRCEP.113.000758.
|
| 3. |
Pagel PS, Kehl F, Gare M, Hettrick DA, Kersten JR, Warltier DC. Mechanical function of the left atrium: new insights based on analysis of pressure-volume relations and Doppler echocardiography. Anesthesiology [Internet]. 2003;98(4):975-94. Available from: http://www.ncbi.nlm.nih.gov/pubmed/12657862.
|
| 4. |
Aktan İkiz ZA, Üçerler H, Özgür T. Anatomic characteristics of left atrium and openings of pulmonary veins. Anadolu Kardiyol Derg [Internet]. 2014;14(8):674-8. Available from: http://www.ncbi.nlm.nih.gov/pubmed/25188756.
|
| 5. |
Lavanya K, Mgbemena ON, Keim SG. Atrio-Ventricular Dyssynchrony After Cardiac Resynchronization Therapy: An Unusual Contributor to Heart Failure Symptoms. Cureus [Internet]. 2023;15(3): e35661. Available from: https://www.cureus.com/articles/112036-atrio-ventricular-dyssynchrony-after-cardiac-resynchronization-therapy-an-unusual-contributor-to-heart-failure-symptoms.
|
| 6. |
Pasipoularides A. Right and left ventricular diastolic pressure-volume relations: a comprehensive review. J Cardiovasc Transl Res [Internet]. 2013;6(2):239-52. Available from: http://www.ncbi.nlm.nih.gov/pubmed/23179133.
|
| 7. |
Bayes de Luna AJ. [Block at the auricular level]. Rev Esp Cardiol [Internet]. 1979;32(1):5–10. Available from: http://www.ncbi.nlm.nih.gov/pubmed/441485.
|
| 8. |
Bayés de Luna A, Baranchuk A, Alberto Escobar Robledo L, Massó van Roessel A, Martínez-Sellés M. Diagnosis of interatrial block. J Geriatr Cardiol [Internet]. 2017;14(3):161-5. Available from: http://www.ncbi.nlm.nih.gov/pubmed/28592957.
|
| 9. |
Bayés de Luna A, Platonov P, Cosio FG, Cygankiewicz I, Pastore C, Baranowski R, et al. Interatrial blocks. A separate entity from left atrial enlargement: a consensus report. J Electrocardiol [Internet]. 2012;45(5):445-51. Available from: http://www.ncbi.nlm.nih.gov/pubmed/22920783.
|
| 10. |
Alexander B, Haseeb S, van Rooy H, Tse G, Hopman W, Martinez-Selles M, et al. Reduced P-wave Voltage in Lead I is Associated with Development of Atrial Fibrillation in Patients with Coronary Artery Disease. J Atr Fibrillation [Internet]. 2017;10(4):1657. Available from: http://www.ncbi.nlm.nih.gov/pubmed/29487682.
|
| 11. |
Jasic-Szpak E, Marwick TH, Donal E, Przewlocka-Kosmala M, Huynh Q, Gozdzik A, et al. Prediction of AF in Heart Failure With Preserved Ejection Fraction: Incremental Value of Left Atrial Strain. JACC Cardiovasc Imaging [Internet]. 2021;14(1):131-44. Available from: http://www.ncbi.nlm.nih.gov/pubmed/33413883.
|
| 12. |
Baranchuk A, Alexander B, Cinier G, Martinez-Selles M, Tekkesin AI, Elousa R, et al. Bayés’ syndrome: Time to consider early anticoagulation? North Clin Istanbul [Internet]. 2018;5(4):370-8. Available from: http://www.ncbi.nlm.nih.gov/pubmed/30815636.
|
| 13. |
Escobar-Robledo LA, Bayés-de-Luna A, Lupón J, Baranchuk A, Moliner P, Martínez-Sellés M, et al. Advanced interatrial block predicts new-onset atrial fibrillation and ischemic stroke in patients with heart failure: The “Bayes’ Syndrome-HF” study. Int J Cardiol [Internet]. 2018;271:174-80. Available from: https://linkinghub.elsevier.com/retrieve/pii/S0167527318310192.
|
| 14. |
Watanabe Y, Nakano Y, Hidaka T, Oda N, Kajihara K, Tokuyama T, et al. Mechanical and substrate abnormalities of the left atrium assessed by 3-dimensional speckle-tracking echocardiography and electroanatomic mapping system in patients with paroxysmal atrial fibrillation. Hear Rhythm [Internet]. 2015;12(3):490-7. Available from: http://www.ncbi.nlm.nih.gov/pubmed/25485778.
|
| 15. |
Mark JB, Ahmed SU, Kluger R, Robinson SM. Influence of jet direction on pulmonary vein flow patterns in severe mitral regurgitation. Anesth Analg [Internet]. 1995;80(3):486-91. Available from: http://www.ncbi.nlm.nih.gov/pubmed/7864412.
|
| 16. |
Stassen J, Namazi F, van der Bijl P, van Wijngaarden SE, Kamperidis V, Marsan NA, et al. Left Atrial Reservoir Function and Outcomes in Secondary Mitral Regurgitation. J Am Soc Echocardiogr [Internet]. 2022;35(5):477-485.e3. Available from: http://www.ncbi.nlm.nih.gov/pubmed/35074443.
|
| 17. |
Nagueh SF, Smiseth OA, Appleton CP, Byrd BF, Dokainish H, Edvardsen T, et al. Recommendations for the Evaluation of Left Ventricular Diastolic Function by Echocardiography: An Update from the American Society of Echocardiography and the European Association of Cardiovascular Imaging. J Am Soc Echocardiogr [Internet]. 2016;29(4):277-314. Available from: http://www.ncbi.nlm.nih.gov/pubmed/27037982.
|
| 18. |
Kapłon-Cieślicka A, Kupczyńska K, Dobrowolski P, Michalski B, Jaguszewski MJ, Banasiak W, et al. On the search for the right definition of heart failure with preserved ejection fraction. Cardiol J [Internet]. 2020;27(5):449-68. Available from: http://www.ncbi.nlm.nih.gov/pubmed/32986238.
|
| 19. |
Santos ABS, Kraigher-Krainer E, Gupta DK, Claggett B, Zile MR, Pieske B, et al. Impaired left atrial function in heart failure with preserved ejection fraction. Eur J Heart Fail [Internet]. 2014;16(10):1096-103. Available from: http://www.ncbi.nlm.nih.gov/ pubmed/25138249.
|
| 20. |
Ponikowski P, Voors AA, Anker SD, Bueno H, Cleland JGF, Coats AJS, et al. 2016 ESC Guidelines for the diagnosis and treatment of acute and chronic heart failure: The Task Force for the diagnosis and treatment of acute and chronic heart failure of the European Society of Cardiology (ESC) Developed with the special contribution of. Eur Heart J [Internet]. 2016;37(27):2129-200. Available from: http://www.ncbi.nlm.nih.gov/pubmed/27206819.
|
| 21. |
Platonov PG. Interatrial conduction in the mechanisms of atrial fibrillation: from anatomy to cardiac signals and new treatment modalities. Europace [Internet]. 2007;9 Suppl 6:vi10-6. Available from: http://www.ncbi.nlm.nih.gov/pubmed/17959684.
|
| 22. |
Cabrera JA, Sánchez-Quintana D. Cardiac anatomy: what the electrophysiologist needs to know. Heart [Internet]. 2013;99(6):417-31. Available from: https://heart.bmj.com/lookup/doi/10.1136/heartjnl-2011-301154.
|
| 23. |
de Luna AB, Massó-van Roessel A, Robledo LAE. The Diagnosis and Clinical Implications of Interatrial Block. Eur Cardiol [Internet]. 2015;10(1):54-9. Available from: http://www.ncbi.nlm.nih.gov/pubmed/30310424.
|
| 24. |
Frydas A, Morris DA, Belyavskiy E, Radhakrishnan A-K, Kropf M, Tadic M, et al. Left atrial strain as sensitive marker of left ventricular diastolic dysfunction in heart failure. ESC Hear Fail [Internet]. 2020;7(4):1956-65. Available from: http://www.ncbi. nlm.nih.gov/pubmed/32613770.
|
| 25. |
Chhabra L, Devadoss R, Chaubey VK, Spodick DH. Interatrial block in the modern era. Curr Cardiol Rev [Internet]. 2014;10(3):181-9. Available from: http://www.ncbi.nlm.nih.gov/pubmed/24827803.
|
| 26. |
Ramdat Misier NL, van Schie MS, Li C, Oei FBS, van Schaagen FRN, Knops P, et al. Epicardial high-resolution mapping of advanced interatrial block: Relating ECG, conduction abnormalities and excitation patterns. Front Cardiovasc Med [Internet].2023;9. Available from: https://www.frontiersin.org/articles/10.3389/fcvm.2022.1031365/full.
|
| 27. |
Russo V, Marano M, Nigro G. Watch the P wave in COVID-19 patients: the interatrial block. J Cardiovasc Med (Hagerstown) [Internet]. 2021;22(12):e51. Available from: http://www.ncbi.nlm.nih.gov/pubmed/33534300.
|
