

Internet searching may predict novel symptoms, but not new outbreaks. A long-term evaluation of infoveillance in COVID-19


Abstract
Background: At the beginning of COVID-19 pandemic authors in several countries reported the possibility of predicting disease outbreaks using internet analysis and search tools like GoogleTrends™. Our aim was to investigate the impact of changes in COVID-19 symptomatology and pandemic intensity on those predictions.
Material and methods: GoogleTrends™ was utilized to track online searches for COVID-19 symptoms in Poland during two years of the pandemic. Search volumes were then assessed for correlation with daily cases in each wave of infection separately.
Results: The symptoms that correlated strongly with new cases were anosmia and ageusia (Spearman’s rho = 0.5230 and rho = 0.4483 respectively, p < 0.01). Searches for these symptoms preceded an outbreak by 12 days during the first wave of infections, but this gap was later shortened to five days. The frequency of searching for these symptoms markedly diminished during the last phase and was no longer adequate. Stronger correlations were then shown for fever, sore throat, and headache.
Conclusions: In conclusion, COVID-19 case prediction using GoogleTrends™ did not remain possible later on in the pandemic course. However, noticeable changes reflecting novel features of emerging SARS-CoV-2 variants were observed. Therefore, monitoring symptom changes and virus evolution might be a promising application of internet search analysis in the future.
Citation
Radziwon J A, Lubiejewski M, Waszak P M, Heleniak Z, Dębska-Ślizień M A. Internet searching may predict novel symptoms, but not new outbreaks. A long-term evaluation of infoveillance in COVID-19. Eur J Transl Clin Med. 2023;6(2):71-77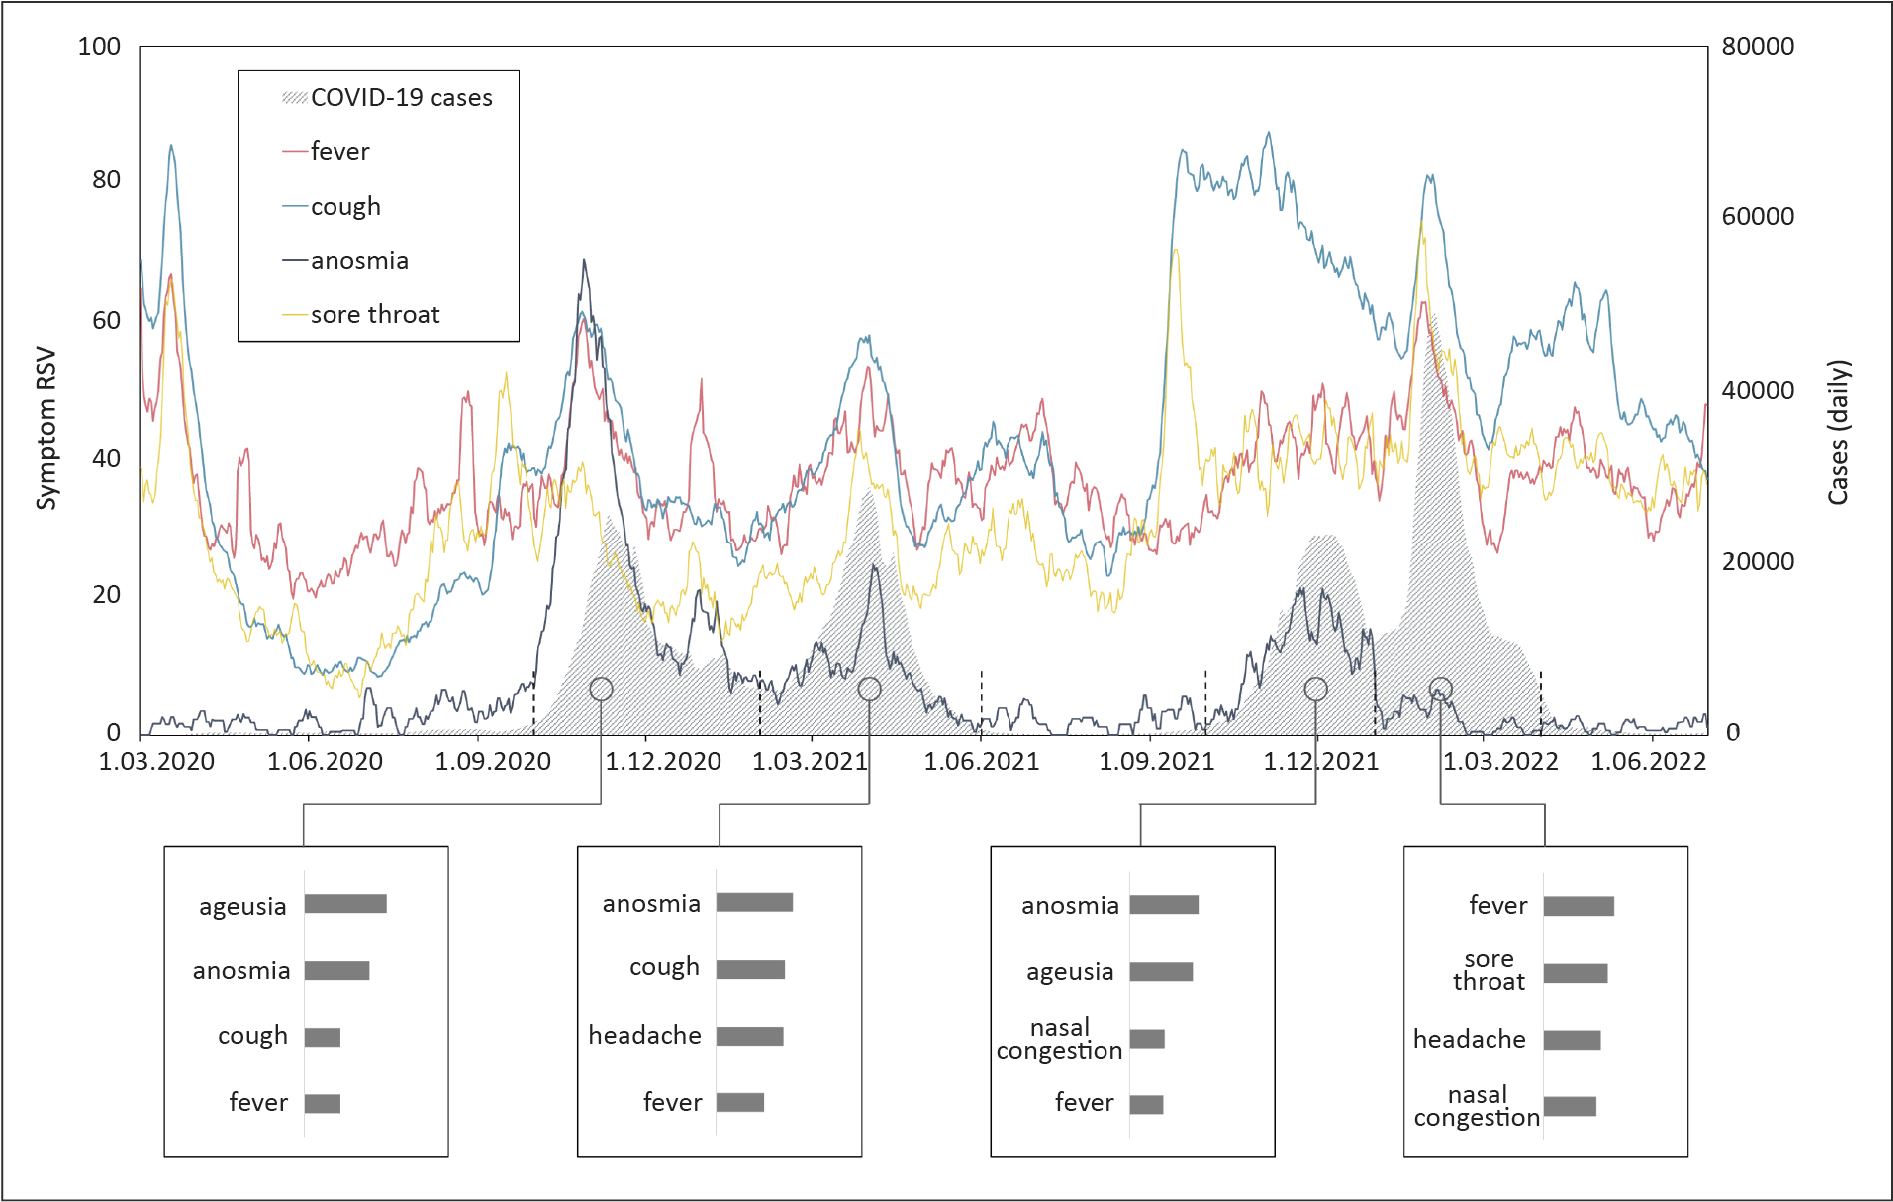


Introduction
As an emerging field of science, infodemiology aims to analyze internet data in order to uncover useful information about public health [1]. Before the era of the Severe Acute Respiratory Syndrome Virus 2 (SARS-CoV-2) pandemic, infodemiology was predominantly involved in the fields of infectious diseases and mental health [2]. Implementation of novel techniques for the surveillance of contagious diseases seems extremely advantageous nowadays and such an approach is called infoveillance [3]. Recently, investigations early in the pandemic demonstrated the possibility of recognizing new Coronavirus Disease 2019 (COVID-19) symptoms [4] and pointed toward the possibility of monitoring the pandemic using the Google Trends™ (GT) web tool [5-6]. This method enables the monitoring of anonymized internet users’ searches related to various public health issues. Searching for any selected term is divided by number of all searches in the area and presented as a relative number with its temporal variation [7]. Early escalation in those values, representing increased public interest in COVID-19-related topics was considered an early sign of a forthcoming outbreak [5]. However, the major part of these data are from the initial period of the pandemic, within the first year since the global outbreak [8]. Therefore, the aim of our study was to investigate whether this internet tool can still be useful, despite substantial changes of pandemic course and the evolution of the SARS-CoV-2 virus itself.
Methods
GT data are presented as a relative search volume (RSV) – a number from 0 to 100 representing the relative intensity of searching [1]. Absolute numbers of searches are not available, while RSVs are a fraction of selected phrase searching in all the searches recorded in the particular region. In GT one phrase could be searched as a topic (group of similar terms and translations predefined by the platform operator) or a term (an exact word or combination of words). Relative search volumes have been acquired for 4 topics (“Coronavirus”, “Coronavirus disease 2019”, “COVID-19 testing”, “COVID-19 vaccine”) and 13 search terms describing the symptoms (fever, cough, dyspnea, fatigue, muscle aches, headache, loss of smell (anosmia), loss of taste (ageusia), sore throat, nasal congestion, rhinorrhea, nausea, diarrhea). All phrases were searched in the Polish language, the area of interest was set to Poland and “all categories” were selected. The interval in which the data are shown depends on the selected period of observation [1]. Therefore, to cover the 2 years of the pandemic in daily intervals, the extraction of data was divided into four periods (01.03 – 30.09.2020; 01.10.2020 – 30.04.2021; 01.05 – 30.11.2021; 01.12.2021 – 30.06.2022). One term was checked in each query for all four periods, which provided proportional values for comparison between periods, but not between terms. We followed the guidelines for reporting GT medical research [2]. Numbers of new cases, number of SARS-CoV-2 tests conducted and vaccination numbers were obtained from the ‘Our World in Data’ database, which contains data from the official government reports [9].
For analysis, the data was further divided into five periods, one for each “wave” of SARS-CoV-2 infection reported in Poland. We adopted the following numeration: wave “0” for the initial period of the COVID-19 pandemic in Poland (when the number of cases remained relatively low) and consecutive numbers for the major peaks of infection rates. The specific timeframes were: 01.03.2020 – 31.05.2020, 01.10.2020 – 31.01.2021, 01.02.2021 – 31.05.2021, 1.10. 2021 – 31.12.2021, 01.01.2022 – 31.03.2022.
RSVs were tested for correlation with the daily number of cases diagnosed or tests and vaccinations performed. Models for 3, 5, 7, 9, 10, 12, and 14-day time lags between searching and diagnosis were tested to find the best-fitting model for each wave separately. Statistical analyses were conducted using the Statistica 13 Software (TIBCO Software Inc., CA, USA). The distribution of all data was assessed using the Kolmogorov-Smirnov test and further analyzed using the non-parametric Spearman’s correlation test as RSVs generally follow a non-normal distribution. The significance level was set at α = 0.05.
Only publicly available internet resources were used In this study. Individual patient data was not analyzed and therefore the Ethical Committee approval was not required.
Results
Searches for the topic ‘COVID-19’ closely correlated with the distribution of reported cases, while the topic ‘Coronavirus’ was prominent mostly during the first weeks of the pandemic. Searching for ‘COVID-19 testing’ correlated very strongly with the number of SARS-CoV-2 tests conducted (rs = 0.9088, p < 0.01) and RSV of ‘COVID-19 vaccine’ with the volume of new vaccinations (rs = 0.6644, p < 0.01). A significant positive correlation between the RSV and the recorded new cases have been found regarding 0, 5, 7, 4 and 7 symptoms in each wave respectively, while the most distinguished pattern was presented by the symptoms anosmia and ageusia (Table 1).
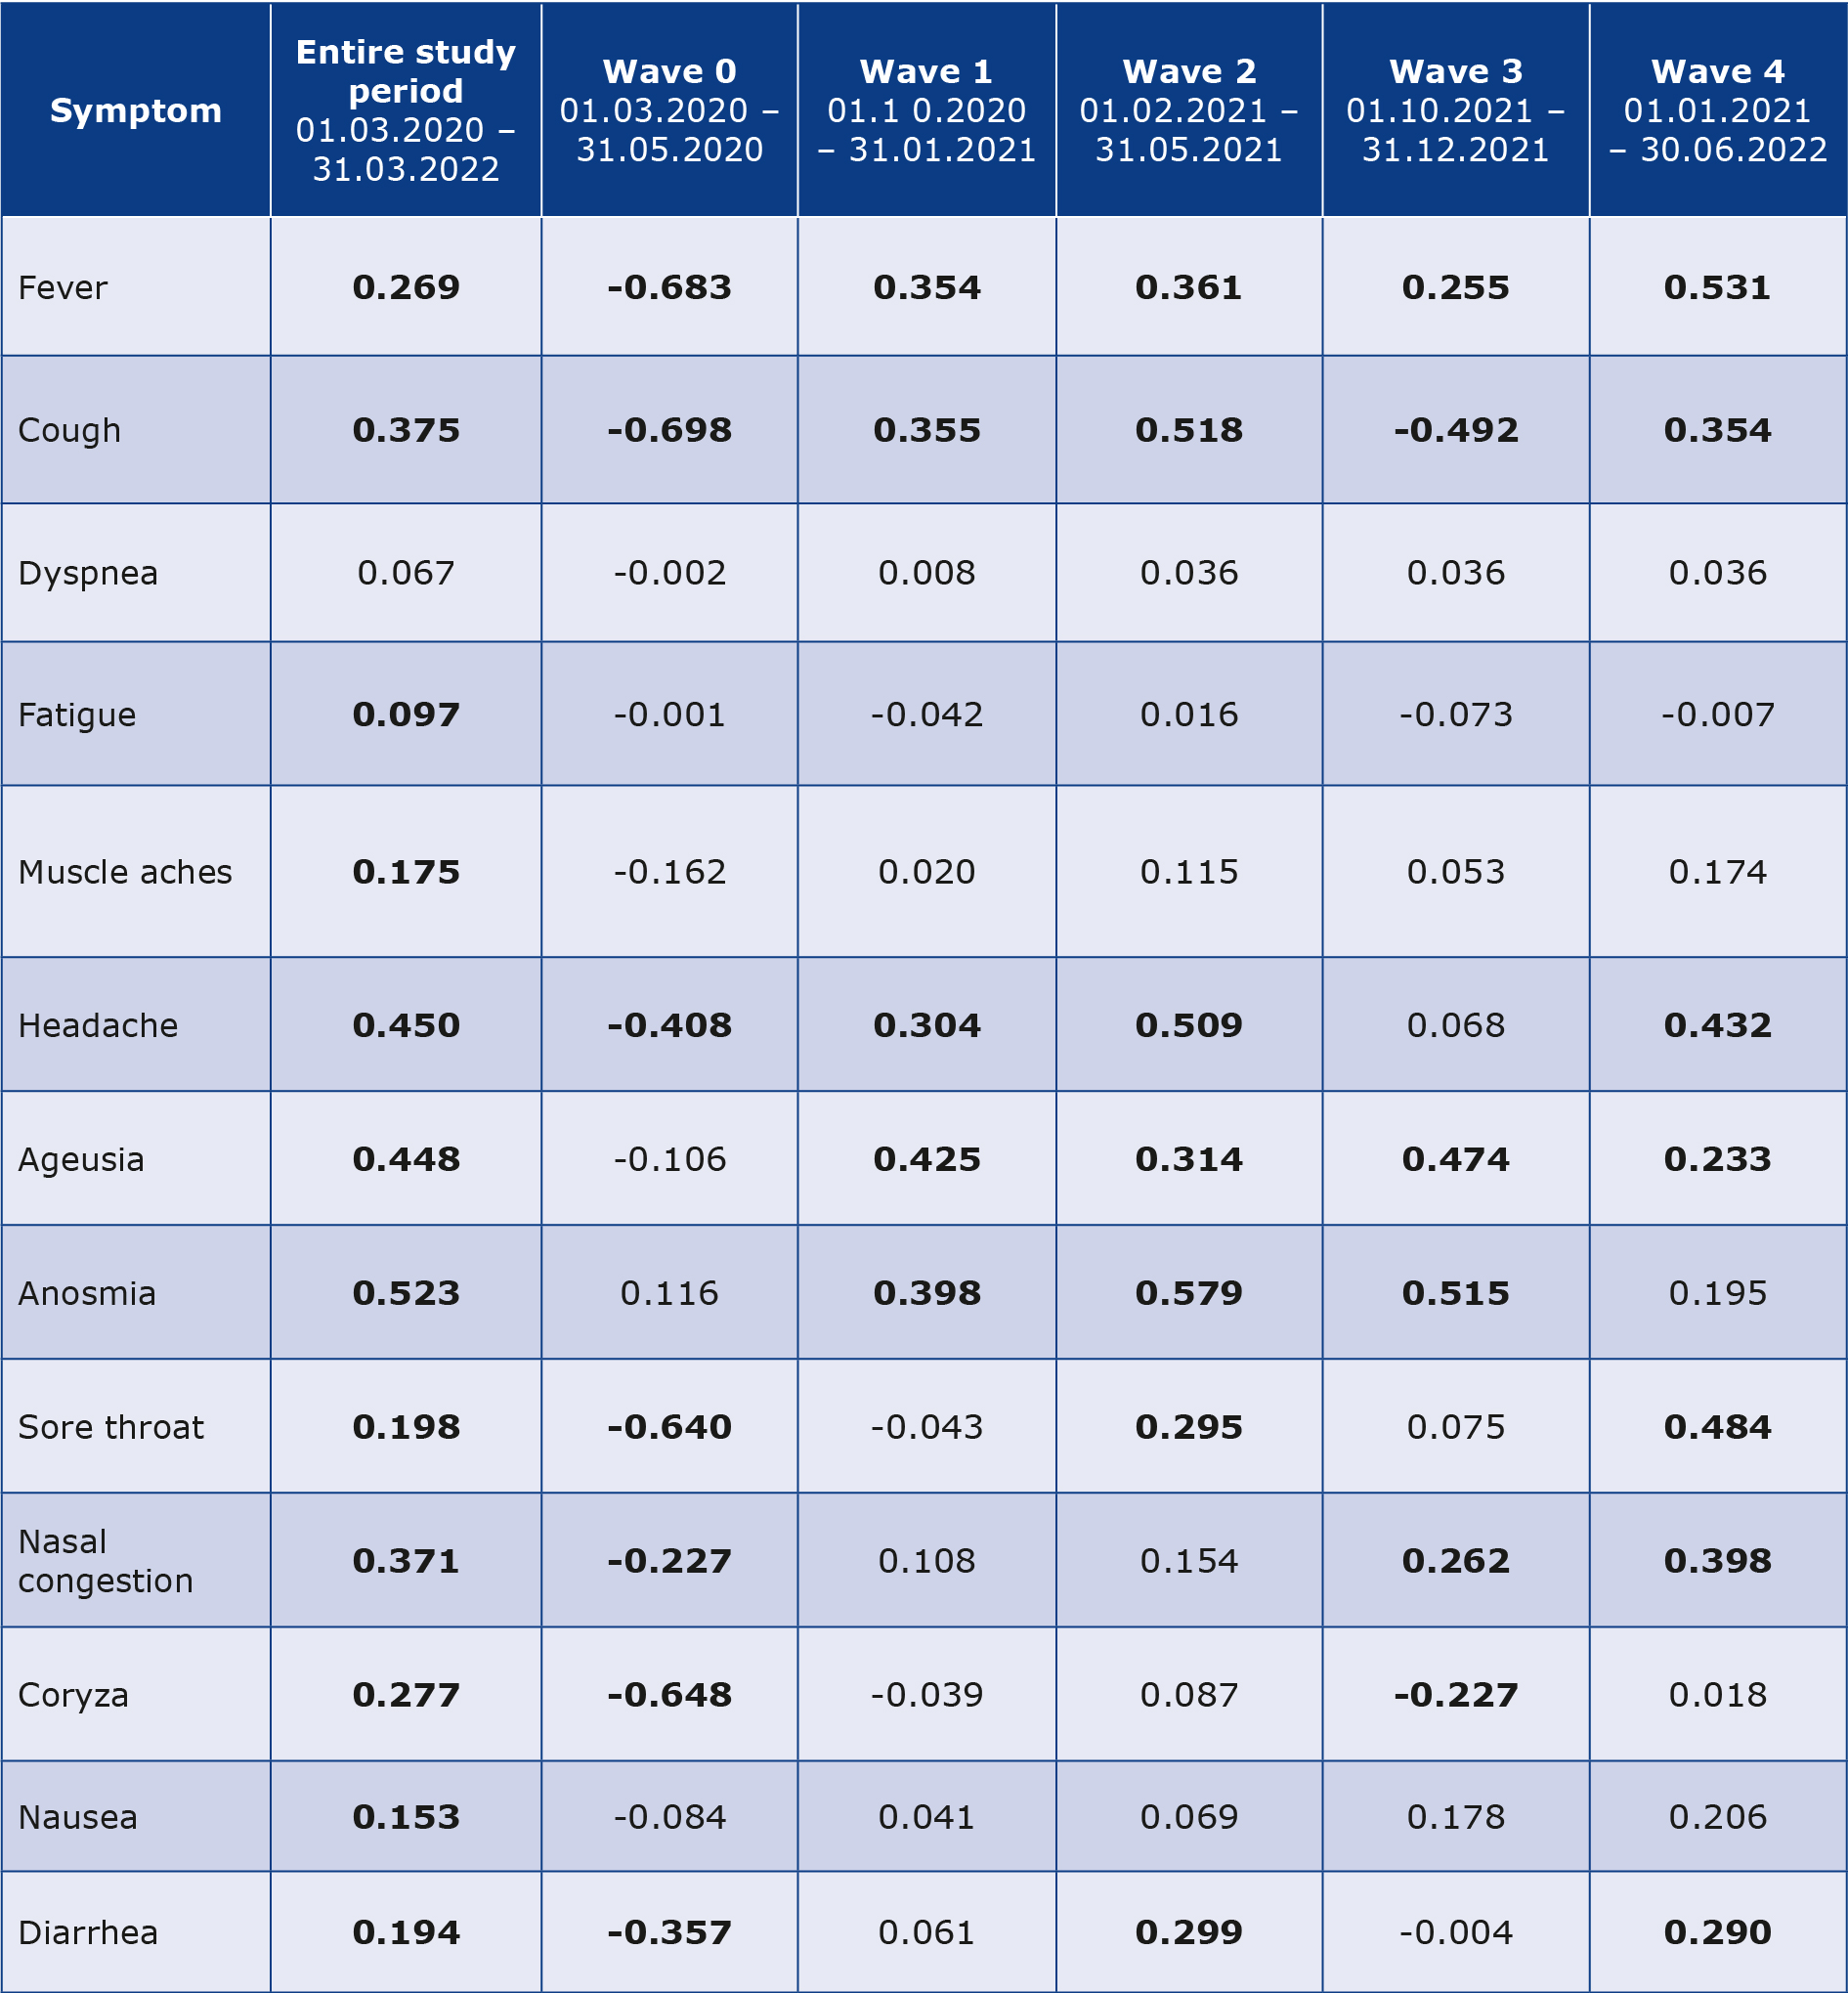
Table 1. Results of Spearman’s rank-order correlation test between search volumes of symptoms and daily detected COVID-19 cases
Correlation coefficients were calculated for the whole observation period, as well as for each wave of infections separately. Statistically significant (p < 0.05) values are bolded.
Correlation coefficients were highest in the model in which searching for these terms was followed by a 12-day lag period to a subsequent outbreak in the first wave. However, later in the pandemic, these terms were searched with only 5-day lag (2nd and 4th wave). Fever and cough were other symptoms searched for in the same way. Fever RSVs were correlated moderately with new cases, but higher after application of different time lags (12 days for 0, 1st and 3rd wave and 5 days for 2nd and 4th wave). Cough presented positive correlation in waves 1, 2, 4 but negative during 3rd wave. During the “0” wave, the majority of symptoms presented a negative correlation due to low and stable COVID-19 counts and RSVs diminishing after initially high interest. The most appropriate time lag for each symptom in the subsequent waves is presented in Table 2.
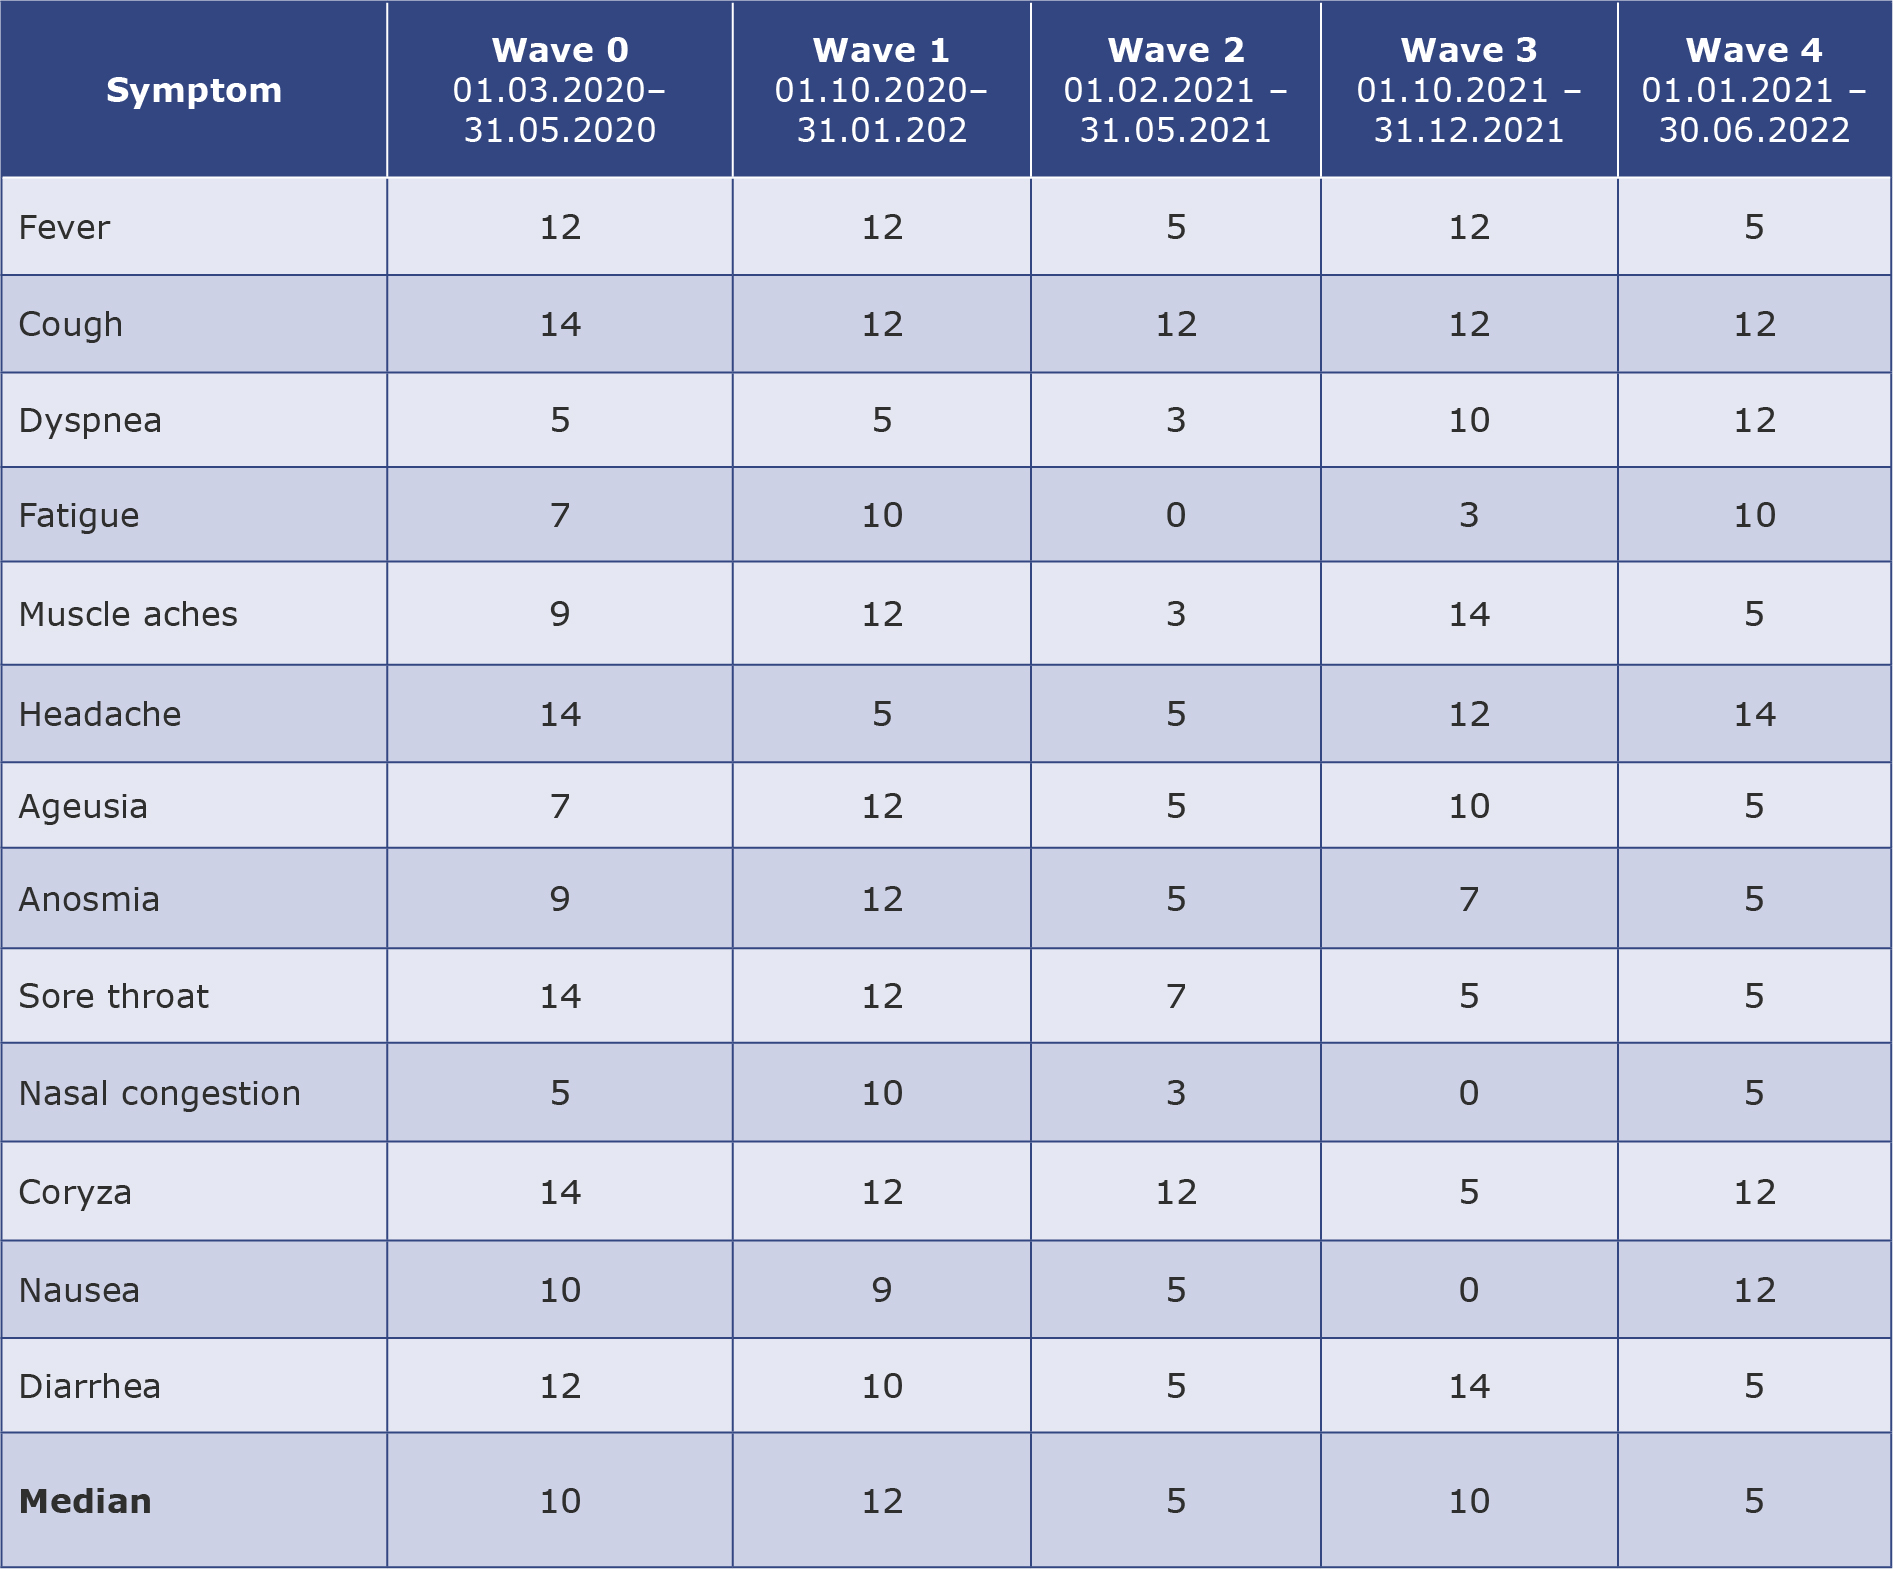
Table 2. The best-fitted time lag models for prediction of wave outbreak
Values in the table represent the number of days between increased searching for a particular symptom and a rise in COVID-19 cases.
Other symptoms showed various distribution across pandemic waves. Until late 2021, the symptoms that most prominently correlated with new cases were “ageusia” and “anosmia”. However, the 4th wave was connected to a different set of symptoms, including “fever”, which was the most correlated term, along with “sore throat”, “headache” and “nasal congestion”. Changes in the symptom searching and the highly correlated symptoms across the pandemic’s waves are shown on Figure 1.
Figure 1. Relative Search Volumes of characteristic symptoms across the study period. Daily new COVID-19 cases are marked by grey area, while relative search volumes (RSVs) of selected symptoms are in color lines. Investigated wave periods are separated by dashed lines on the horizontal axis. Symptoms presenting the highest correlation coefficients in each wave are listed in the brackets below with the bar length representing correlation coefficient proportionally.
Discussion
It is clear from the distribution of search volumes in the current study that searching for COVID-related news and symptoms was a common activity in recent months and more-less resembled the dynamic of ongoing pandemic. Indeed, the most disease-specific symptoms such as anosmia and ageusia were primarily searched in line with patterns of virus transmission. Henry et al [10], demonstrated that search volumes for “anosmia” and “ageusia” could almost perfectly predict a proceeding COVID-19 outbreak in Poland within the next 1-week or 2-weeks. Based on daily data, our results revealed that a 12-day delay was more accurate, however this time lag was only observable in 2020. Several months later, these symptoms were searched just 5 days before an outbreak and searching for them almost completely stopped in the spring of 2022. Case prediction based on other symptoms was less accurate, as they occur in many different diseases, including non-infectious and chronic. The role of these symptoms was seldom analyzed in COVID-19 infodemiology research [11] and our study confirms their low suitability for this purpose. For instance, searches for “cough” peaked during COVID-19 waves in 2020 as well as independently of them in September 2021 and April 2022. During the heaviest restrictions in 2020 and 2021 (corresponding to waves 0, 1 and 2 in our study), the circulation of other viruses diminished [12] and searches for common symptoms were more likely to be related to COVID-19 infections, however this was no longer the case in the following months. The issue of low viability of GT in tracking COVID-19 was already raised by Asseo et al. [13] and our long-term observations support their findings.
On the other hand, a shift in symptom searches was manifested in following phases with a diminishing interest in “anosmia” and “ageusia” and an increasing frequency of “fever”, “sore throat”, and “nasal congestion” searches. These results reflect the substantial change in the prevalence of symptoms noted with the emergence of the Omicron variant. The most frequent symptoms prior to its outbreak were fatigue, headache, cough, and impaired smell or taste, but those infected later were more likely to present with rhinorrhea, sore throat, and fever [14]. Another change was the incubation period of the virus: 5-6 days on average for the ancestral strain, while for the Delta variant it was ~4 days and 3 days for the Omicron [15]. Our results are in line with these reports, as the median time lag for positively-correlated symptoms was 12 days in the Fall of 2020 and decreased to 5 days during the Omicron wave. However, this might also be attributed to greater public awareness, faster recognition of symptoms, and increased availability of testing.
Despite its potential, GT does raise some credibility issues that researchers should be aware of. Foremost, an association between searches and the actual incidence of illnesses remains to be defined and may vary by disease, region and observation period. Furthermore, search data are generally prone to overestimation when there is intense media coverage of the topic [16]. This was the case of the 0 wave in our study, when people were intensively searching for COVID-19 information, despite the relatively low incidence at that time. It appears that internet search data analysis is an important and promising method, however more complex approaches to building epidemiological models are required to accurately anticipate the spread of infectious agents. Our data shows that the current approach can help predict the general occurrence of an increased spread or changes in symptomatology, however, a precise estimation of cases is not possible by using Google Trends alone. A combination of data from different search engines and social media data, potentially combined and calculated by artificial intelligence, may help to recognize danger quickly [17] . Surely, the future of epidemiology will be based on digital tools to a great extent. Infectious diseases surveillance based on internet sources, molecular sewage monitoring or mobile data tracking has been proven useful before [18-19]. We believe that the possibilities of big data processing and artificial intelligence implementation, instead of individual clinical data may be faster, more accurate and valuable for public health.
Conclusions
The suitability of Google Trends™ analysis for case prediction in infectious diseases is not universal and heavily depends on the proper timing and selection of keywords. This approach may provide overestimation and inaccurate forecasts. Nevertheless, monitoring early changes such as the incubation period and new symptoms of previously known diseases may be a promising application for infodemiology in the future.
Conflicts of interest
None to report.
Funding
Not applicable.
------------------------
(Image source: https://pixabay.com/illustrations/covid-omicron-statistics-curve-6892470/)
References
| 1. |
Mavragani A, Ochoa G. Google Trends in Infodemiology and Infoveillance: Methodology Framework. JMIR Public Heal Surveill [Internet]. 2019;5(2):e13439. Available from: http://publichealth.jmir.org/2019/2/e13439/.
|
| 2. |
Nuti S V., Wayda B, Ranasinghe I, Wang S, Dreyer RP, Chen SI, et al. The Use of Google Trends in Health Care Research: A Systematic Review. Voracek M, editor. PLoS One [Internet]. 2014;9(10):e109583. Available from: https://dx.plos.org/10.1371/journal.pone.0109583.
|
| 3. |
Eysenbach G. Infodemiology and Infoveillance: Framework for an Emerging Set of Public Health Informatics Methods to Analyze Search, Communication and Publication Behavior on the Internet. J Med Internet Res [Internet]. 2009;11(1):e11. Available from: http://www.jmir.org/2009/1/e11.
|
| 4. |
Walker A, Hopkins C, Surda P. Use of Google Trends to investigate loss‐of‐smell‒related searches during the COVID‐19 outbreak. Int Forum Allergy Rhinol [Internet]. 2020;10(7):839–47. Available from: https://onlinelibrary.wiley.com/doi/10.1002/alr.22580.
|
| 5. |
Effenberger M, Kronbichler A, Shin J Il, Mayer G, Tilg H, Perco P. Association of the COVID-19 pandemic with Internet Search Volumes: A Google TrendsTM Analysis. Int J Infect Dis [Internet]. 2020;95:192–7. Available from: https://linkinghub.elsevier.com/retrieve/pii/S1201971220302496.
|
| 6. |
Mavragani A. Tracking COVID-19 in Europe: Infodemiology Approach. JMIR Public Heal Surveill [Internet]. 2020;6(2):e18941. Available from: http://publichealth.jmir.org/2020/2/e18941/.
|
| 7. |
Basics of Google Trends. Google News Initiative [Internet]. 2023 [cited 2023 Sep 26]. Available from: https://newsinitiative.withgoogle.com/pl-pl/resources/trainings/basics-of-google-trends/.
|
| 8. |
Springer S, Zieger M, Strzelecki A. The rise of infodemiology and infoveillance during COVID-19 crisis. One Heal [Internet]. 2021;13:100288. Available from: https://www.sciencedirect.com/science/article/pii/S2352771421000781.
|
| 9. |
Mathieu E, Ritchie H, Rodés-Guirao L, Appel C, Gavrilov D, Giattino C, et al. Coronavirus Pandemic (COVID-19) [Internet]. Our World in Data. 2020 [cited 2022 Oct 9]. Available from: https://ourworldindata.org/coronavirus.
|
| 10. |
Henry BM, Szergyuk I, Santos de Oliveira MH, Lippi G, Juszczyk G, Mikos M. Utility of Google Trends in anticipating Coronavirus Disease 2019 (COVID-19) outbreaks in Poland. Polish Arch Intern Med [Internet]. 2021 Mar 26; Available from: https://www.mp.pl/paim/issue/article/15894.
|
| 11. |
Yousefinaghani S, Dara R, Mubareka S, Sharif S. Prediction of COVID-19 Waves Using Social Media and Google Search: A Case Study of the US and Canada. Front Public Heal [Internet]. 2021;9. Available from: https://www.frontiersin.org/articles/10.3389/fpubh.2021.656635/full.
|
| 12. |
Chow EJ, Uyeki TM, Chu HY. The effects of the COVID-19 pandemic on community respiratory virus activity. Nat Rev Microbiol [Internet]. 2023;21(3):195–210. Available from: https://doi.org/10.1038/s41579-022-00807-9.
|
| 13. |
Asseo K, Fierro F, Slavutsky Y, Frasnelli J, Niv MY. Tracking COVID-19 using taste and smell loss Google searches is not a reliable strategy. Sci Rep [Internet]. 2020;10(1):20527. Available from: https://www.nature.com/articles/s41598-020-77316-3.
|
| 14. |
Schulze H, Bayer W. Changes in Symptoms Experienced by SARS-CoV-2-Infected Individuals – From the First Wave to the Omicron Variant. Front Virol [Internet]. 2022;2. Available from: https://www.frontiersin.org/articles/10.3389/fviro.2022.880707/full.
|
| 15. |
Infection [Internet]. European Centre for Disease Prevention and Control. An agency of the European Union. [cited 2022 Oct 31]. Available from: https://www.ecdc.europa.eu/en/covid-19/latest-evidence/infection.
|
| 16. |
Butler D. When Google got flu wrong: US outbreak foxes a leading web-based method for tracking seasonal flu. Nature [Internet]. 2013 Oct 24;494:155–6. Available from: https://link.gale.com/apps/doc/A319614599/HRCA?u=anon~179f8fd3&sid=googleScholar&xid=6d3dccfb.
|
| 17. |
White BK, Gombert A, Nguyen T, Yau B, Ishizumi A, Kirchner L, et al. Using Machine Learning Technology (Early Artificial Intelligence–Supported Response With Social Listening Platform) to Enhance Digital Social Understanding for the COVID-19 Infodemic: Development and Implementation Study. JMIR Infodemiology [Internet]. 2023 Aug 21;3:e47317. Available from: https://infodemiology.jmir.org/2023/1/e47317.
|
| 18. |
van Boven M, Hetebrij WA, Swart A, Nagelkerke E, van der Beek RF, Stouten S, et al. Patterns of SARS-CoV-2 circulation revealed by a nationwide sewage surveillance programme, the Netherlands, August 2020 to February 2022. Eurosurveillance [Internet]. 2023 Jun 22;28(25). Available from: https://www.eurosurveillance.org/content/10.2807/1560-7917.ES.2023.28.25.2200700.
|
| 19. |
Murray J, Cohen AL. Infectious Disease Surveillance. In: International Encyclopedia of Public Health [Internet]. Elsevier; 2017. p. 222–9. Available from: https://linkinghub.elsevier.com/retrieve/pii/B9780128036785005178.
|
