
Access to healthcare as an important moderating variable for understanding the geography of COVID-19 outcomes – preliminary insights from Poland


Abstract
Introduction: Biases in the measurement of COVID-19 burden and the uncertainty in estimation of the corresponding epidemiologic indexes are known and common phenomena in infectious diseases. We investigated to what extent healthcare access (HCA)-related supply/demand interfered with the registered data on COVID-19 in Poland.
Material and Methods: We ran a multiple linear regression model with interactions to explain the geographic variation in seroprevalence, hospitalizations (on the voivodeship – NUTS-2 level) and current (beginning of the 4th wave of COVID cases – 15.09-21.11.2021) case notifications/crude mortality (on poviat – old NUTS-4 level). We took vaccination coverage and cumulative case notifications up to the so called 3rd wave as predictor variables and supply/demand (HCA) as moderating variables.
Results: HCA with interacting terms (mainly demand) explained to the great extent the variance of current incidence and most of the variance in the current mortality rates. HCA (mainly supply) was significantly moderating cumulative case notifications until the 3rd wave of cases, thus explaining the variance in seroprevalence and hospitalization.
Conclusion: Seeking causal relations between the vaccinationor infection-gained immunity level and the current infection dynamics could be misleading without understanding the socio-epidemiologic context such as the moderating role of HCA (sensu lato). After quantification, HCA could be incorporated into epidemiologic models for improved prediction of the actual disease burden.
Citation
Jarynowski A, Belik V. Access to healthcare as an important moderating variable for understanding the geography of COVID-19 outcomes – preliminary insights from Poland . Eur J Transl Clin Med. 2022;5(2):5-15


Introduction
From epidemiologic practice, we already know that registered disease case notifications do not reflect the actual burden of infections (including so called “dark figure”) to the same extent in various geographic locations due to socio-economic-medical inequalities [1]. Therefore, healthcare access (HCA) has already been identified as a possible factor influencing measurable Coronavirus disease 2019 (COVID-19) epidemic indexes and explaining intra-country variation [2-5]. Thus, more resource-rich regions were able to organize both testing and treatment resources [6] and vaccination campaigns [7] in a faster and more inclusive way, whereas resource-poor regions were much more selective in the pandemic healthcare services delivery.
Epidemiological modeling and healthcare analytics
Knowing immunity levels is important for proper prediction of the COVID-19 dynamics for a given region. Researchers proposed multiple methods and models explaining acquiring natural immunity (possibly after infection) and vaccine-induced immunity, taking into account their interactions as well as various immunity waning schema [8-9]. We know quite well how the efficacy of various vaccines is waning over time [10] against symptomatic infections (controlled for covariates such as seasonality or virus variants), however post-infection immunity is much more difficult to assess [11]. Seroprevalence studies also can be used to estimate immunity levels and have previously been used extensively to estimate infection fatality rate (IFR) [12-13].
Modeling Paradoxes
To unravel the so-called “epidemiological mystery” of COVID-19 [14] it is currently attempted to identify the contextual factors associated with case and death reports with real infection and fatality rates. Researchers from Institute for Health Metrics and Evaluation [14] estimated that the cumulative number of unreported cases until the so-called 4th wave of COVID-19 varies significantly even among countries within close geographic proximity. Using Eastern Europe as an example (“dark figure” size), in Slovakia the number of reported cases should be increased by 13% in order to reflect the estimate of actual infection, in Poland by 517%, while in Russia by 2230%. This example published in The Lancet reveals the scale of the problem associated with reporting and understanding COVID-19 outcomes. Moreover, some recent ecological studies are suggesting a weak or no link between vaccination coverage and the current (Delta variant) epidemic dynamics in the general populations [15- 16] as well as little to no effect of NPI (nonpharmaceutical interventions) on COVID-19 incidence and mortality [17-18]. Not surprisingly, these findings caused a wave of controversy and our observations put a new light on them.
HCA and modeling
Surprisingly, HCA has not yet been significantly addressed in the practice of infection dynamics modeling [5]. Although immunity is gained and lost at the individual level, it is often attempted to quantify the immunity level at a population level, for instance by accounting for biased measures such as estimates of undiagnosed cases or eliciting seroprevalence via surveys. Innacurate estimates of COVID-19 immunity levels varying across time and regions make predictions challenging and significantly reduce predictive power. Therefore, forecast results often deviate from reality, as was the case in Poland between June – September 2021 [19]. It is worth mentioning that the simple forecasting model “PL_GRedlarski-DistrictsSum” (created by a volunteer from the Medical University of Gdańsk) which sums up extrapolation of COVID-19 cases’ trajectories in poviats (implicitly assuming their idiosyncrasy and heterogeneity driven by HCA among others) is overperforming in short- and medium-term all other models [20], including those that are financed and used by Polish Ministry of Health or ECDC. Albeit we could simply mechanistically mimic reporting patterns, we still do not know what are intra-country differences in shares of unreported cases. More or less accurate inter-country estimates in Eastern Europe (sharing the similar post-communist social and health care patterns) are showing variability greater than two orders of magnitude [14].
Our aim was to show on the example of Poland that omitting HCA confounding/moderating factors could lead to misinterpretation in understanding the current epidemic dynamics due to biased estimation of immunity levels and other epidemiologic indexes.
Material and methods
Data description
Data obtained from the registries of 16 voivodeships of Poland (Nomenclature of Territorial Units for Statistics, NUTS-2) and 380 poviats (old NUTS-4) only from publicly available official sources or their archived versions. For instance, historical hospitalization rates are not publicly available and only can be scrapped from the archives of governmental webpages. In our model we considered the variables listed below.
Independent variables:
- Cumulative No, cases per capita: The cumulative numbers of COVID-19 notifications until the so-called 3rd wave of epidemic (04.03.2020-15.06.2021) for poviats and voivodeships [21] divided by its population size.
- Fraction of vaccinated: Percentage of people vaccinated with at least one dose for poviats and voivodeships (at the end of 3rd wave at 15.06.2021) for all age groups [22]. Vaccination coverage gives us a proxy of proportions of population which gain post-vaccination immunity before the so-called 4th wave.
Moderating variables:
- Healthcare Access – Supply (supply HCA): The number of physicians working in health care per 10000 inhabitants in 2019 as an indicator of the HCA supply for poviat and voivodeship [23]. This is a good proxy for capacity and accessibility of healthcare (public and private).
- Healthcare Access – Demand (demand HCA): The number of consultations in primary care provided in 2019 for poviats and voivodeships as an indicator of the demand for HCA [23]. Pearson correlation between demand HCAs in 2019 and 2020 is 0.998 [7], so no significant regional changes have been observed in the demand for HCA due to the pandemic. Demand for HCA is a complex conglomerate of attitudes towards healthcare (i.e., level of trust in the effectiveness of treatment offered by public healthcare), perceptions of accessibility (i.e., how easily one can reach healthcare facilities), and disease burden (i.e., elderly and inferior health populations are more likely to seek for healthcare).
Dependent variables:
- Normalized incidence Sep/Oct’21: 2-week incidence of COVID-19 notifications (21.09–04.10.2021) during the beginning of the so-called 4th epidemic wave for a poviat [21].
- Normalized deaths Sep/Nov’21: Crude mortality rate – Cumulative number of COVID-19 death cases (15.09- 21.11.2021) during the so-called 4th epidemic wave per poviat divided by its population size [24].
- Normalized hospitalizations: Number of occupied hospital beds (14.10.2021) at the beginning of the so-called 4th epidemic wave per voivodeship divided by its population size [25].
- Obser-Co: The fraction of seroconverted [26] per voivodeship in a random (by design) sample as a proxy for immunity level collected during 29.03-14.05.2021. This variable is a good proxy of post-infection acquired immunity as this time frame was the end of the 3rd epidemic wave and at the start of the vaccination roll-out was at the beginning.
The dynamics of the SARS-CoV-2 spread vary across the spatial clusters and initial conditions as the number of index cases and immunity levels could lead to different phases at the beginning of each wave. We chose the beginning of the 4th wave for epidemiologic indexes (dependent variables): hospitalizations and incidence due to relatively equal distribution of the Delta variants across country, when the wealthier part of population returns from vacation trips abroad [27], children return to school (September) but before the start of the new academic year in October (possible movement of population to large cities), in order to avoid some artefacts due to introduction or re-emergence of variants [6, 28]. For mortality rates, we decided to take a longer period (up to maximum in incidence of 4th wave), in order to gather enough data.
HCA access definition
Supply/demand HCA are assumed to be moderating variables that affect the relationship between the independent variables (vaccine or post-infection immunity at the end of the 3rd wave) and dependent variables (seroprevalence and the 4th wave outbreak outcomes).
Our bidimensional HCA measure is a combination of [5, 14, 29-33]:
- Regional healthcare capacity or quality (corresponding to supply HCA) which other researchers have sought to examine, such as Health Security Index, Universal Health Coverage Index, Healthcare Accessibility and Quality Index, Human Development Index, number of physicians or nurses per capita, number of hospital beds per capita, government and total health spending per capita, number of tests performed per capita, Cumulative Standardized Testability Ratio;
- Behavioral patterns of using healthcare related to population demographic or comorbidity structure (corresponding to demand HCA) which other researchers were trying to capture by age structure (e.g., share of seniors), BMI (e.g., share of obese), pulmonary or immunodeficiency diseases prevalence, number of medical consultations, share of smokers;
- The affective social conditions corresponding to the way how people are likely to seek healthcare services (corresponding to demand HCA) which other researchers have tried to capture by the prevalence of magical thinking (e.g. interests in alternative medicine), ethnic structure, political populism, income inequality (e.g. intra- or inter-regional Gini coefficient), trust (in medical professionals, government or science) and affective autonomy (the normative tendency for people to maximize their own utility).
Thus, our socio-medical concept of HCA is covering a wide range of complex constructs and the goal of this paper is to demonstrate its importance.
Regression models
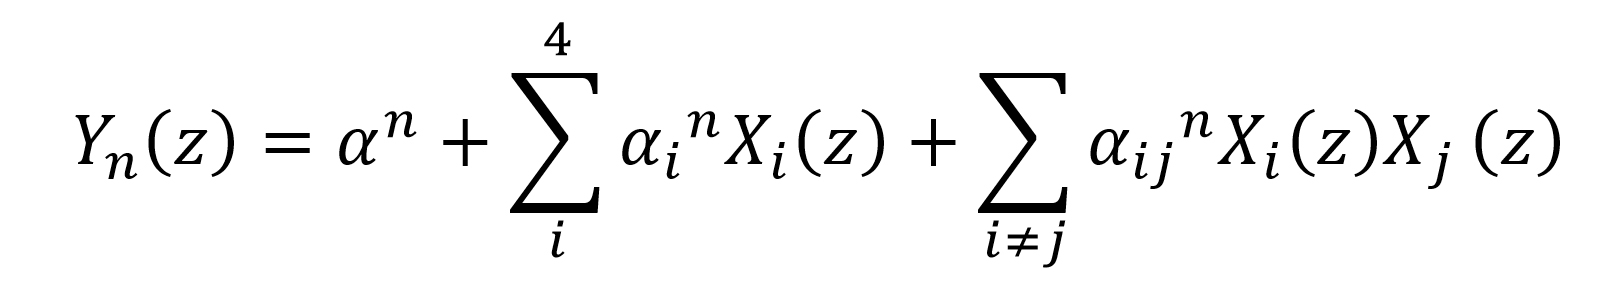
We provide an empirical, rather than theoretical, approach for analyzing the links between the dependent and independent variables moderated by covariates (HCA). The commonly used approach (though not the state of the art [34]) for assessing a causal model is a multiple regression analysis [35] with interactions between variables (moderating and independent). Multiple linear regression was proposed in 4 equations n∈{1,2,3,4} with 4 predictors consisting of i∈{1,2} independent and ∈{3,4} moderating variables:
Where generally: Yn are dependent variables; X1 and X2 are independent variables; X3 and X4 are moderating variables, XiXj are 2- way interactions terms among the predictors.
Where specifically: Y1 – seroprevalence – Obser-Co; Y2 – Normalized Hospitalizations; Y3 – Normalized incidence Sep/Oct’21; Y4 – Normalized deaths Sep/Nov’21; z is one of 18 voivodships for Y1 and Y2 or one of 380 poviats for Y3 and Y4 ; X1 – Cumulative No. cases per capita (independent variable); X2 – Fraction of vaccinated (independent variable); X3 – Healthcare Access – Supply/supply HCA (moderating variable); X4 – Healthcare Access – Demand/demand HCA (moderating variable); α are intercepts (without subscript indices) and slope parameters (with subscript indices).
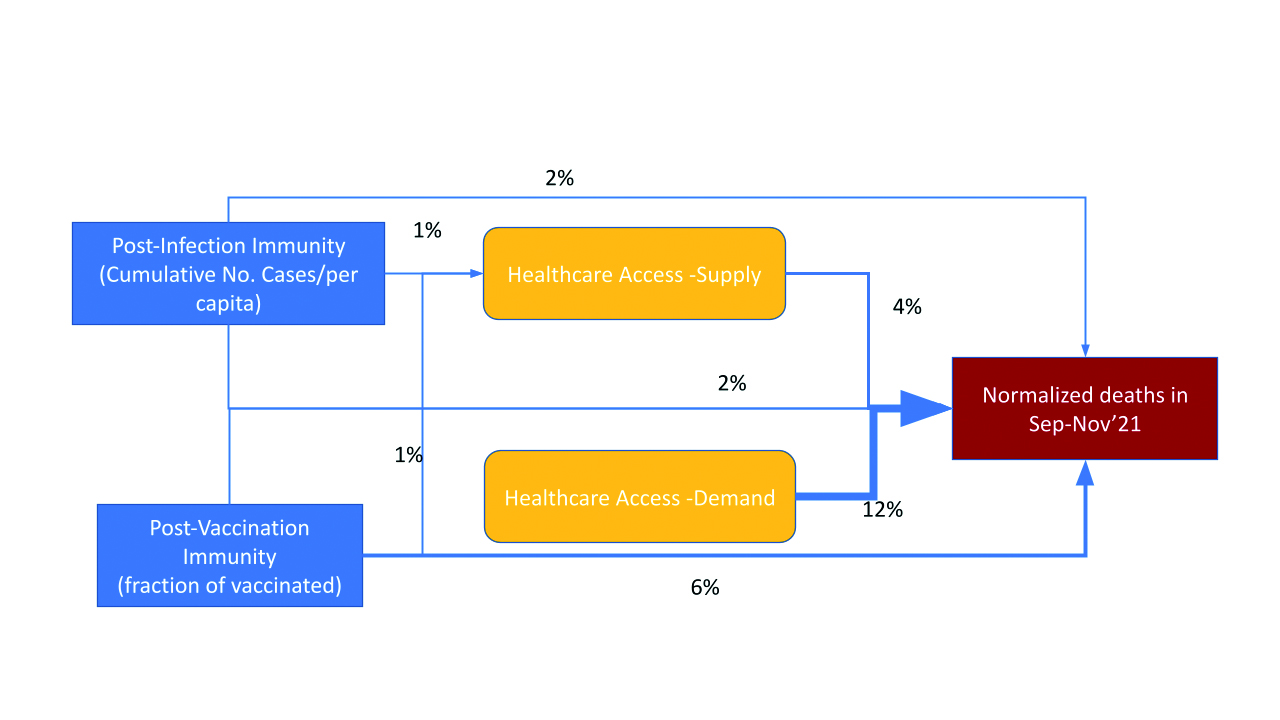
Flow of explained variance of each dependent Yn variable (in %) by predictors Xi and interactions among them is drawn on diagrams (Fig. 3-6). Models at the level of each geographical unit (poviat and voivodeship) should be compared separately. Because there is a known geographical phenomenon that the use of larger spatial units (NUTS-2/3, voivodeships) results in a better adjustment of statistical models (higher explained variance), due to the aggregation (averaging) of data for these units [36]. Graphical representation of possible causation links on diagrams is an informal visualization tool in our case, but has a formal mathematical form [37] for instance in Structural Equation Modeling (SEM), Path Diagrams or Directed Acyclic Graphs (DAG). Our model does not formally recognize independent or moderating variables, so presentation of directionality of interactions terms on diagrams is convention only.
Results
Data exploration
Descriptive statistics of variables were analyzed. Clusters of correlated related variables can be noticed in a hierarchical arrangement of the correlation matrix and corresponding dendrograms (Fig. 1).
Figure 1. Pearson correlation matrix between the variables considered in the analysis in the hierarchical system. Dependent variables were considered at the poviat (Top) and voivodship (Bottom) levels. Independent and moderating variables available at the poviat level have been aggregated to the voivodeship level
There is a very strong and significant (R = 0.74, p-V = 0.03) correlation between the demand for HCA and cumulative cases per capita (Fig. 1 Top). To remind, demand HCA was assessed before the pandemic started, thus geographic distribution of reported normalized cases aggregated over the first three waves is highly dependent on the structural patterns of how people tend to use healthcare. On the other hand, the supply of HCA is strongly correlated with the vaccination rate (R = 0.59, p-V = 0.09). This could mean that the vaccination program was more popular in regions with higher healthcare capacity. On the voivodeship level (Fig. 1 Right) seroprevalence is significantly and negatively correlated with demand HCA (R = -0.43, p-V = 0.05) as well as negatively correlated with cumulative cases (R = -0.51, p-V = 0.06). It is important to note the paradox, that higher reported cumulative cases correspond to lower seroconversion rate, which can only be explained by the structural geographical biases (for instance, due to intra-voivodeship variation in the variables being compared or inter-voivodeship variation of undiagnosed cases). Unfortunately, hospitalization rates are not available on poviat level, so we choose to visualize geography of cumulative and current incidences mediated by demand HCA (Fig. 2 right) and vaccination rates and crude mortality moderated by supply HCA (Fig. 2 left).
Figure 2. Map of the selected significant determinants of COVID-19 outcomes on poviat level. Left: with Supply HCA, Right: with demand HCA
Mapping (Fig. 2) shows that both moderating HCAs are highly granulated and do not cluster spatially to such extent as independent variables [6-7]. Thus, due to high heterogeneity within even close geographic neighborhoods (for instance between big cities and rural poviats), analysis on the level of voivodeship could be not sufficient.
Regression models
The following predictor variables were used: vaccination coverage, cumulative case notifications, conditions moderating supply/demand HCA as well as 2-way interactions among them (Tab. 1, Fig. 3-6).
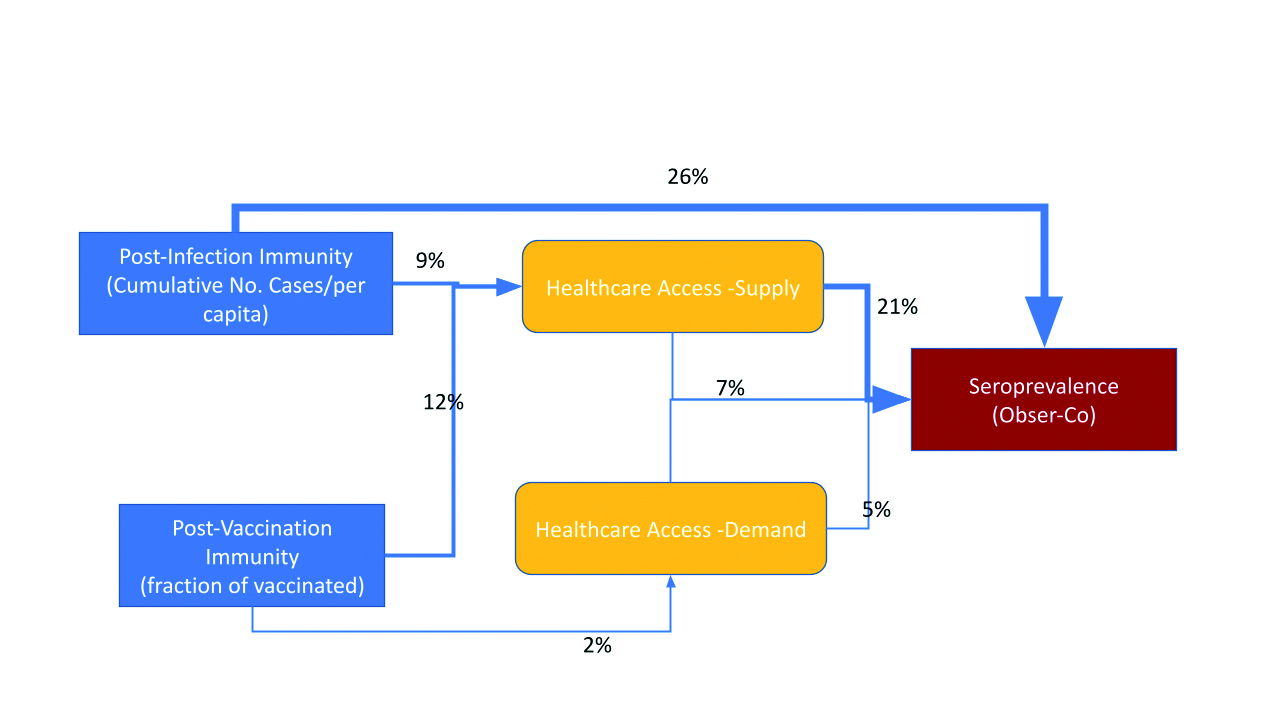
Figure 3. Explained variance of seroprevalence at the end of 3rd wave – immunity level estimation from Obser-Co [26] on voivodeship level
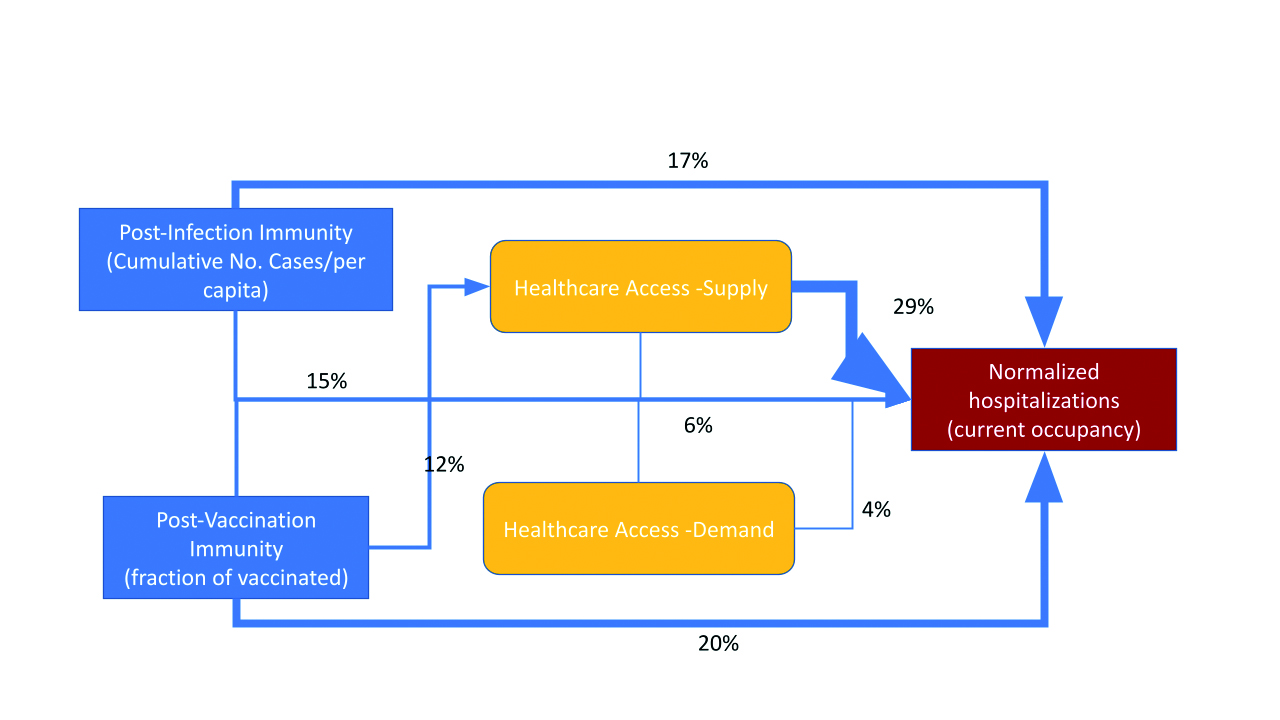
Figure 4. Explained variance of hospitalizations during the 4th wave on the voivodeship level
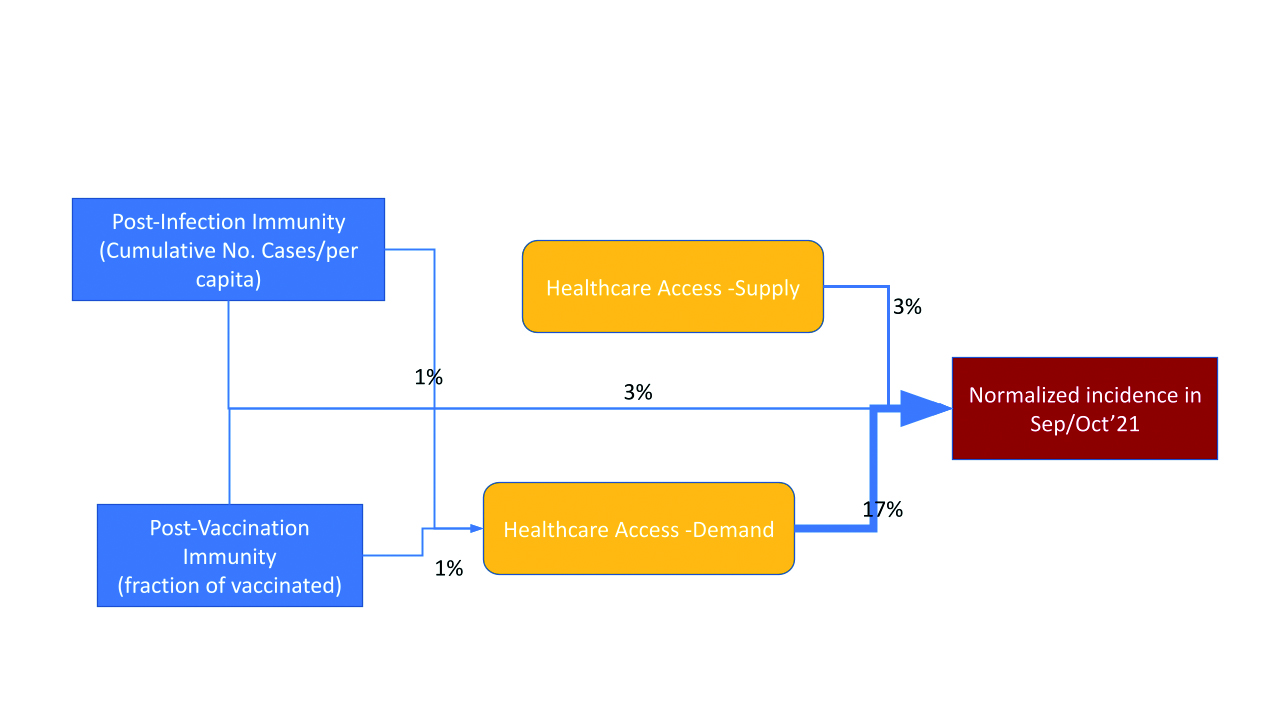
Figure 5. Explained variance of normalized case notifications (14-days incidence) during the 4th wave on the poviat level
Figure 6. Explained variance of crude mortality rate during the 4th wave on the poviat level
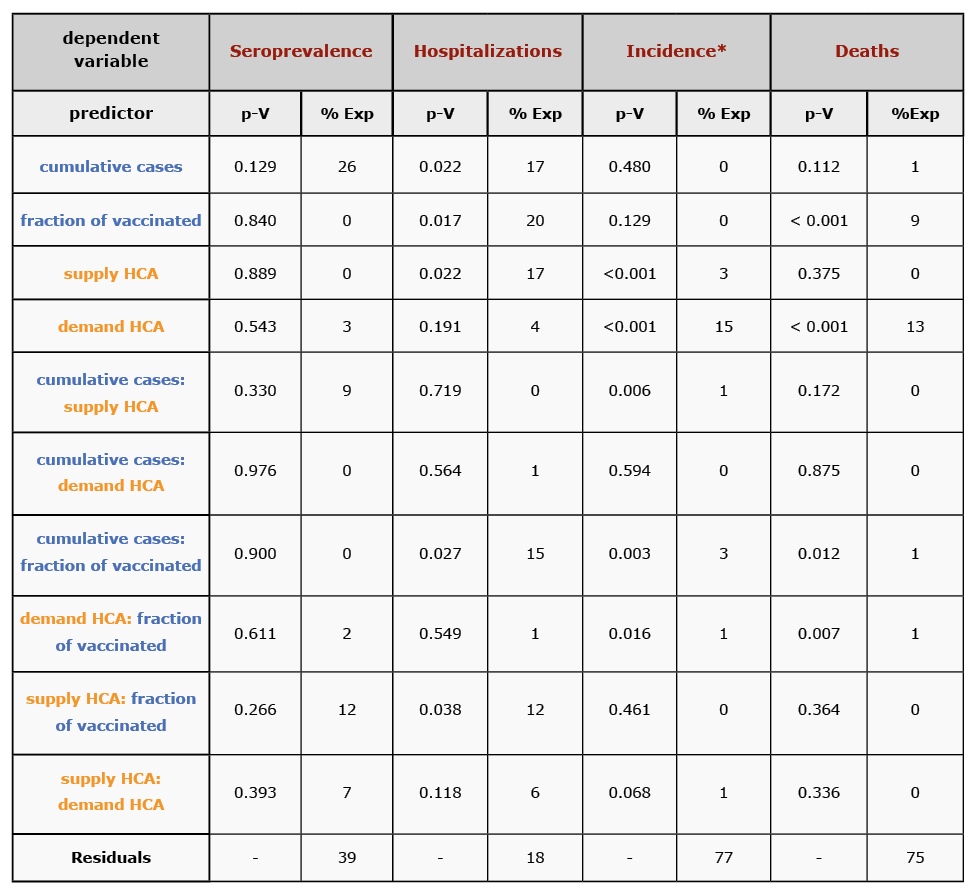
The models presented in Table 1 were not selected according to statistical criteria. Therefore, there may be other models based on the same set of predicting variables with a better fit. However, these simple regressions allow us to highlight which variables and which interactions need further investigation. More variance is explained for hospitalizations (82%) than seroprevalence (61%) on the voivodeship level. More variance is explained for deaths (25%) than incidence (23%) on the poviat level. In a series of diagrams, we depict the explained share of variance for selected dependent variables of interest as calculated by multiple regression.
HCA (mainly supply indirectly) is significantly influencing seroprevalence survey results (Fig. 3). Thus, 9% of variance is explained by the interaction between cumulative case notifications and supply HCA. It’s worth mentioning that demand HCA is even significantly correlated with seroprevalence surveys (see Fig. 1 Top), which has not been replicated in the regression model (only 3% of explained variance directly). Most of the variance in seroprevalence is explained directly (26%) by cumulative cases notifications. Vaccination was in a very early stage at the time of the seroprevalence survey, however there is an interaction pattern between supply HCA and vaccination (12%).
Hospitalizations seem to be well predicted by vaccination coverage and cumulative cases notifications (47% of variance considering also the interaction between them). HCA (mainly supply) affects hospitalizations (Fig. 4), but 12% of variance is explained by the interaction between vaccination coverage and supply HCA.
HCA (mainly demand) is extremely important (Fig. 5-6) to predict current infections dynamic (incidence and mortality). It is worth stressing that the direct links between vaccination coverage as well as cumulative case notifications with current incidence are statistically negligible (only the interactions with these terms have some impact).
Crude mortality rate (Fig. 6) in comparison to incidence (Fig. 5) during the beginning of the 4th wave is less prone to the confounding effect of HCA. We can see a significant link between vaccination coverage and crude mortality rate due to COVID-19 (Fig. 6).
Discussion
Discussion of regressions
There are multiple possible mechanisms explaining mediating role of HCA (however causal statements cannot be defined as probably both explaining and explanatory variable seems to depend on HCA):
- In regions with high healthcare service/worker availability (supply HCA) patients are more likely to be sampled as seroconverted (Fig. 3), have a higher chance of finding a hospital bed (Fig. 4), as well as higher chance of being tested (and get a positive result) (Fig. 5).
- Case notifications, as well as in some extent crude mortality (Fig. 5, 6) are highly correlated with the way patients are likely to use the public healthcare system (demand HCA), thus in regions with low demand HCA the real number of infections seems to be underestimated by documented case notifications to a higher extent than in places with high demand HCA.
We found that hospitalizations seem to be the most understandable for a given set of predictor variables (the highest variance explained and potentially strong model robustness) as well the least dependent on HCA (Tab. 1, Fig. 4). On the other hand, incidence is the most difficult to assess and interpret (the lowest variance explained and weak model robustness) as well as the most prone to be driven by HCA (Tab. 1, Fig. 5).
Table 1. Percentage of explained variance (%Exp) and significance level (p-V) for dependent variables (red) for given selection of predictors with interactions as independent variables (blue) or moderating variables (yellow)
* Incidence is sensitive to quadratic as well 3rd way interaction terms, thus it will need further robustness analysis.
Modeling paradoxes and interpretation
Each epidemiological index is more or less confounded by HCA in different ways: seroprevalence obtained via surveys and hospitalizations mainly by supply HCA, but documented case notifications and crude mortality rates mainly by demand HCA. All of the investigated epidemiologic indexes (Tab. 1) are highly dependent on HCA within a single country with similar surveillance methodology across regions (at least in theory). Therefore, inter-country comparison or measuring effectiveness of vaccination or NPIs for a selected index lead to possible biases in interpretation [14, 16-18] even unintentionally. As we found that that reported geographic variability of incidence is more prone to be driven by the socio-epidemiological factors rather than the dynamic infectious process, all of the ecological analysis using this outcome must be interpreted with extreme caution. Moreover, the lack of or even slightly positive correlations between the reported incidence (during the 3rd and 4th wave) and the vaccination rates by regions was confirmed in our study as significantly confounded by HCA (Fig. 5). As this argument is often used by the so-called anti-vaccination and anti-sanitarian movements, it is worth mentioning that causal relation cannot be claimed with the observed moderating role of HCA (possibly due to bias in the tendency of seeking available healthcare in the mild course of the disease). Thus, vaccination was not only averting hospitalizations [25] or death tolls [38] in Poland (Fig. 4, 6), but also probably has reduced transmission probability (at least until the introduction of the Omicron variant), although it may be partially masked by inequalities in HCA (Tab. 1, Fig. 5).
Limitations and future work
It’s important to mention that regression with incidence as an independent variable is the least robust (sensitive to adding 3-way interaction terms as well nonlinear forms of dependent variables), however this is out of scope of this preliminary work. This study is only an exploratory, socalled “zero” approach to illustrate the mediating phenomenon due HCA differences between geographical regions. Our approach has multiple limitations because vaccination coverage, cumulative case notifications, seroprevalence and current outbreak dynamics are snapshots from a given time point and were considered for different time periods. Due to availability of explained variables on different levels (voivodeship or poviat) model comparison should be done with caution. Other possible interfering variables were not taken into consideration (such as socio-economic-demographic portrait of the population) and other studies found that HCA could be collinear with multiple variables [39]. Further causal modeling using a longitudinal approach is required to support our preliminary observations. These results are specific to the Polish population/healthcare system and the role of the HCA could be different in other settings.
Conclusions
Recommendation
The moderating roles of HCA could change over time. However, this simple analysis suggests that including HCA indexes into models of disease dynamics will increase their short-term (meteorological conditions could be added as well [40]) and could increase long-term predictive power. Only triangulated pictures based on reported cases (with estimates of undiagnosed infections), deaths (due to COVID-19 and excess mortality), and hospitalizations (separately with and due to COVID-19), may allow for epidemiological interpretation. Thus, there are mathematical approaches of reducing the bias by combining multiple epidemiological indexes or constituting their derivatives [41-42]. For instance, crude fatality rates [43] seem to be less dependent on HCA than estimates of IFR in Poland. Moreover, recent suggestions of ECDC [44] and WHO [45] to put more emphasis on hospitalizations/mortality rather than laboratory confirmed cases in understanding the burden of disease are also supported by our findings. We regret that data gathered by state is not provided in an easy to analyze format [46] and a massive manual work is needed for data preparation. The most important and probably the least biased variable (according to our preliminary analysis) – hospitalization (being a good proxy for the severe cases) – is not available on poviat level (old NUTS-4) in Poland. We suggest that the number of hospitalized patients originating from a given region (poviat or even municipality) could be a very significant epidemiologic index.
Acknowledgments
We thank Monika Wójta-Kempa, Magdalena Rosińska, Kamil Rakocy and Members of Polish Vaccinological Society for consultations.
Funding
AJ and VB were partially supported by DFG (German Research Foundation, project number 458528774).
Conflicts of interest
None.
Attachments
References
| 1. |
WHO. Handbook on health inequality monitoring: with a special focus on low- and middle-income countries. World Health Organization; 2014.
|
| 2. |
Sun Y, Hu X, Xie J. Spatial inequalities of COVID-19 mortality rate in relation to socioeconomic and environmental factors across England. Sci Total Environ [Internet]. 2021 Mar;758:143595. Available from: https://www.sciencedirect.com/science/article/pii/S0048969720371266.
|
| 3. |
Dahal S, Luo R, Swahn MH, Chowell G. Geospatial Variability in Excess Death Rates during the COVID-19 Pandemic in Mexico: Examining Socio Demographic and Population Health Characteristics. medRxiv [Internet]. 2021 Jan 1;2021.08.11.21261930. Available from: http://medrxiv.org/content/early/2021/08/12/2021.08.11.21261930.abstract.
|
| 4. |
Andersen LM, Harden SR, Sugg MM, Runkle JD, Lundquist TE. Analyzing the spatial determinants of local Covid-19 transmission in the United States. Sci Total Environ. 2021;754:142396.
|
| 5. |
Ayoub HH, Mumtaz GR, Seedat S, Makhoul M, Chemaitelly H, Abu-Raddad LJ. Estimates of global SARS-CoV-2 infection exposure, infection morbidity, and infection mortality rates in 2020. Glob Epidemiol. 2021;3:100068.
|
| 6. |
Jarynowski A, Wójta-Kempa M, Krzowski Ł. An attempt to optimize human resources allocation based on spatial diversity of COVID-19 cases in Poland. medRxiv [Internet]. 2020 Jan 1;2020.10.14.20090985. Available from: https://www.medrxiv.org/content/10.1101/2020.10.14.20090985v1.
|
| 7. |
Jarynowski A. Zróżnicowanie geograficzne szczepień p/COVID-19 w Polsce – nierówności społeczne i peryferyjność, a możliwe środki zaradcze [Polish] [Internet]. Academia. [cited 2022 Aug 30]. Available from: https://www.academia.edu/50340205/Zróżnicowanie_geograficzne_szczepień_p_COVID_19_w_Polsce_nierówności_społeczne_i_peryferyjność_a_możliwe_środki_zaradcze
|
| 8. |
Shearer F. Incorporating vaccine and exposure-acquired immunity into COVID-19 situational assessment [Internet]. The Fields Institute for Research in Mathematical Sciences. 2021 [cited 2022 Aug 30]. Available from: http://www.fields.utoronto.ca/activities/21-22/modelling-immunity.
|
| 9. |
Glasser J. Calculating quantities needed for transmission modeling from large-scale serological surveys of antibodies to SARS-CoV-2 in the United States [Internet]. The Fields Institute for Research in Mathematical Sciences. 2021 [cited 2022 Aug 30]. Available from: http://www.fields.utoronto.ca/talks/Calculating-quantities-needed-transmission-modeling-large-scale-serological-surveys-antibodies.
|
| 10. |
Nordström P, Ballin M, Nordström A. Effectiveness of Covid-19 vaccination against risk of symptomatic infection, hospitalization, and death up to 9 months: a Swedish total-population cohort study. Hosp Death Up to [Internet]. 2021;9(preprint). Available from: https://papers.ssrn.com/sol3/papers.cfm?abstract_id=3949410.
|
| 11. |
Science Brief: SARS-CoV-2 Infection-induced and Vaccine-induced Immunity [Internet]. CDC. 2021 [cited 2022 Aug 30]. Available from: https://www.cdc.gov/coronavirus/2019-ncov/science/science-briefs/vaccine-induced-immunity.html.
|
| 12. |
Ioannidis JPA. Reconciling estimates of global spread and infection fatality rates of COVID‐19: An overview of systematic evaluations. Eur J Clin Invest [Internet]. 2021 May 9;51(5):e13554. Available from: https://doi.org/10.1111/eci.13554.
|
| 13. |
Meyerowitz-Katz G, Merone L. A systematic review and meta-analysis of published research data on COVID-19 infection fatality rates. Int J Infect Dis [Internet]. 2020 Dec;101:138–48. Available from: https://www.sciencedirect.com/science/article/pii/S1201971220321809.
|
| 14. |
Bollyky TJ, Hulland EN, Barber RM, Collins JK, Kiernan S, Moses M, et al. Pandemic preparedness and COVID-19: an exploratory analysis of infection and fatality rates, and contextual factors associated with preparedness in 177 countries, from Jan 1, 2020, to Sept 30, 2021. Lancet [Internet]. 2022;399(10334):1489–512. Available from: https://www.sciencedirect.com/science/article/pii/S0140673622001726.
|
| 15. |
Subramanian S V, Kumar A. Increases in COVID-19 are unrelated to levels of vaccination across 68 countries and 2947 counties in the United States. Eur J Epidemiol [Internet]. 2021;36(12):1237–40. Available from: https://doi.org/10.1007/s10654-021-00808-7.
|
| 16. |
Sobolewski M. Obraz statystyczny polityki zdrowotnej-analiza skuteczności szczepień przeciwko SARS-CoV-2 w zapobieganiu transmisji wirusa. Sympozjum „Oblicza pandemii” [in Polish] [Internet]. The College of Social and Media Culture in Toruń; 2022. Available from: https://www.youtube.com/watch?v=NbxX-yD4oRc&ab_channel=RadioMaryja.
|
| 17. |
Herby J, Jonung L, Hanke SH. A literature review and meta-analysis of the effects of lockdowns on COVID-19 Mortality. Stud Aplied Econ [Internet]. 2022;(200). Available from: http://trudeauknows.ca/wp-content/uploads/2022/03/A-Literature-Review-and-Meta-Analysis-of-the-Effects-of-Lockdowns-on-COVID-19-Mortality.pdf.
|
| 18. |
Talic S, Shah S, Wild H, Gasevic D, Maharaj A, Ademi Z, et al. Effectiveness of public health measures in reducing the incidence of covid-19, SARS-CoV-2 transmission, and covid-19 mortality: systematic review and meta-analysis. BMJ [Internet]. 2021 Nov 18;375:e068302. Available from: http://www.bmj.com/content/375/bmj-2021-068302.abstract.
|
| 19. |
European Covid-19 Forecast Hub. Forecasts · Cases, Poland; (June-September 2021) [Internet]. [cited 2022 Nov 1]. Available from: https://covid19forecasthub.eu/visualisation.html?fbclid=IwAR1dT9Qqb6nK9JLVipZsy6zqyrVg6LTPR5ndnTgi-xDUSB1rSzXg2eNk2So.
|
| 20. |
European Covid-19 Forecast Hub. Forecast scores, Poland [Internet]. 2022 [cited 2022 Aug 30]. Available from: https://covid19forecasthub.eu/reports.html.
|
| 21. |
Rogalski M. Covid-19 wedlug powiatów [in Polish] [Internet]. 2020. Available from: https://docs.google.com/spreadsheets/d/1Tv6jKMUYdK6ws6SxxAsHVxZbglZfisC8x_HZ1jacmBM/edit?usp=sharing.
|
| 22. |
Szczepienia w gminach [in Polish] [Internet]. Serwis Rzeczpospolitej Polskiej. 2022 [cited 2022 Aug 31]. Available from: https://www.gov.pl/web/szczepienia-gmin#/poziomwyszczepienia.
|
| 23. |
Bank danych lokalnych [in Polish] [Internet]. Główny Urząd Statystyczny. 2020 [cited 2022 Aug 31]. Available from: https://bdl.stat.gov.pl/BDL/start.
|
| 24. |
Statystyki zgonów z powodu COVID-19 [in Polish] [Internet]. Ministerstwo Zdrowia, Baza Analiz Systemowych i Wdrożeniowych. 2022. Available from: https://basiw.mz.gov.pl/index.html#/visualization?id=3653.
|
| 25. |
Raport dobowy COVID-19 [in Polish] [Internet]. Ministerstwo Zdrowia. 2021 [cited 2022 Aug 31]. Available from: https://www.gov.pl/web/koronawirus/wykaz-zarazen-koronawirusem-sars-cov-2.
|
| 26. |
Ogólnopolskie Badanie Seroepidemiologiczne COVID-19 – OBSER-CO: raport z I tury badania [in Polish] [Internet]. Narodowy Instytut Zdrowia Publicznego-Państwowy Instytut Badawczy. [cited 2022 Aug 31]. Available from: https://www.pzh.gov.pl/projekty-i-programy/obserco/raporty/.
|
| 27. |
Śleszyński PA. Stages of spatial dispersion of the COVID-19 epidemic in Poland in the first six months (4 March-20 September, 2020) . [Internet]. Vol. 94. Warszawa: IGiPZ PAN; 2021. p. 305–24. Available from: http://rcin.org.pl/igipz/Content/211577/PDF/WA51_245709_r2021-t94-no3_G-Polonica-Sleszynsk.pdf.
|
| 28. |
Jarynowski A, Wójta-Kempa M, Płatek D, Czopek K. Attempt to Understand Public Health Relevant Social Dimensions of COVID-19 Outbreak in Poland. SSRN Electron J [Internet]. 2020;4(3):7–44. Available from: https://www.ssrn.com/abstract=3570609.
|
| 29. |
Jarynowski A, Wójta-Kempa M, Płatek D, Belik V. Social values are significant factors in control of covid-19 pandemic–preliminary results. Preprints.org [Internet]. 2020; Available from: https://www.preprints.org/manuscript/202005.0036/v1.
|
| 30. |
Bosancianu CM, Dionne KY, Hilbig H, Humphreys M, Sampada KC, Lieber N, et al. Political and social correlates of covid-19 mortality. SocArXiv Pap [Internet]. 2020; Available from: https://osf.io/preprints/socarxiv/ub3zd/
|
| 31. |
Messner W, Payson SE. Contextual factors and the COVID-19 outbreak rate across U.S. counties in its initial phase. Heal Sci Reports [Internet]. 2021 Mar 2;4(1). Available from: https://onlinelibrary.wiley.com/doi/10.1002/hsr2.242.
|
| 32. |
Parysek JJ, Mierzejewska L. Spatio-temporal analysis of the development of the COVID-19 epidemic (pandemic) in Poland: First phase of development. Geogr Pol [Internet]. 2021;94(3):325–54. Available from: https://rcin.org.pl/igipz/dlibra/publication/edition/211578.
|
| 33. |
Migała-Warchoł A, Sobolewski M. The influence of the economic situation on the socio-economic development in the European Union countries by means of the modified HDI Index. Technol Transf Innov Solut Soc Sci Humanit [Internet]. 2020 Apr 30;3:28–31. Available from: http://journal.eu-jr.eu/ttissh/article/view/1485.
|
| 34. |
Jonassen DH, Ionas IG. Designing effective supports for causal reasoning. Educ Technol Res Dev [Internet]. 2008;56(3):287–308. Available from: https://link.springer.com/article/10.1007/s11423-006-9021-6.
|
| 35. |
Galea S, Hernán MA. Win-Win: Reconciling Social Epidemiology and Causal Inference. Am J Epidemiol [Internet]. 2020 Mar 2;189(3):167–70. Available from: https://doi.org/10.1093/aje/kwz158.
|
| 36. |
Fotheringham AS, Wong DWS. The Modifiable Areal Unit Problem in Multivariate Statistical Analysis. Environ Plan A Econ Sp [Internet]. 1991 Jul 1;23(7):1025–44. Available from: https://doi.org/10.1068/a231025.
|
| 37. |
Glymour MM, Greenland S. Causal diagrams. Mod Epidemiol [Internet]. 2008;3:183–209. Available from: https://publicifsv.sund.ku.dk/~jhp/KandidatFSV/aar19/Forelaesninger/DAG/GlymourChap12.pdf.
|
| 38. |
Meslé MMI, Brown J, Mook P, Hagan J, Pastore R, Bundle N, et al. Estimated number of deaths directly averted in people 60 years and older as a result of COVID-19 vaccination in the WHO European Region, December 2020 to November 2021. Eurosurveillance. 2021;26(47):2101021.
|
| 39. |
Kowalski PA, Szwagrzyk M, Kielpinska J, Konior A, Kusy M. Numerical analysis of factors, pace and intensity of the corona virus (COVID-19) epidemic in Poland. Ecol Inform [Internet]. 2021;63:101284. Available from: https://www.sciencedirect.com/science/article/pii/S1574954121000753.
|
| 40. |
Bochenek B, Jankowski M, Gruszczynska M, Jaczewski A, Ziemianski M, Pyrc R, et al. Weather as a potential cause of regional differences in the dynamics of the COVID‐19 epidemic in Poland - implications for epidemic forecasting. Polish Arch Intern Med [Internet]. 2021 Oct 8; Available from: https://www.mp.pl/paim/issue/article/16110.
|
| 41. |
Kostoulas P, Meletis E, Pateras K, Eusebi P, Kostoulas T, Furuya-Kanamori L, et al. The epidemic volatility index, a novel early warning tool for identifying new waves in an epidemic. Sci Rep [Internet]. 2021;11(1):23775. Available from: https://doi.org/10.1038/s41598-021-02622-3.
|
| 42. |
Michalak MP, Cordes J, Kulawik A, Sitek S, Pytel S, Zuzańska-Żyśko E, et al. Reducing bias in risk indices for COVID-19. Geospat Health [Internet]. 2022 Jan 14;17(s1). Available from: https://geospatialhealth.net/index.php/gh/article/view/1013.
|
| 43. |
Gogolewski K, Miasojedow B, Sadkowska-Todys M, Stepień M, Demkow U, Lech A, et al. Data-driven case fatality rate estimation for the primary lineage of SARS-CoV-2 in Poland. Methods [Internet]. 2022;203:584–93. Available from: https://www.sciencedirect.com/science/article/pii/S1046202322000123.
|
| 44. |
COVID-19 surveillance guidance - Transition from COVID-19 emergency surveillance to routine surveillance of respiratory pathogens [Internet]. European Centre for Disease Prevention and Control. 2021 [cited 2022 Aug 31]. Available from: https://www.ecdc.europa.eu/en/publications-data/covid-19-surveillance-guidance.
|
| 45. |
Guidance for surveillance of SARS-CoV-2 variants: Interim guidance [Internet]. World Health Organization. 2021 [cited 2022 Aug 31]. Available from: https://www.who.int/publications/i/item/WHO_2019-nCoV_surveillance_variants.
|
| 46. |
Szmuda T, Ali S, Özdemir C, Syed MT, Singh A, Hetzger TV, et al. Datasets and future research suggestions concerning the novel Coronavirus (COVID-19). Eur J Transl Clin Med [Internet]. 2020 Dec 3;3(2):80–5. Available from: https://ejtcm.gumed.edu.pl/articles/72.
|
