Assessment of nutritional status of patients with cancer who are qualified for home enteral nutrition – a retrospective analysis
Abstract
Introduction
Patients with cancer are at risk of malnutrition. The aim of this study was to assess the nutritional status of patients with cancer who are qualified for home enteral nutrition. Secondary aim is to compare the nutritional status of patients with gastric cancer and with esophageal cancer.
Materials and methods
Retrospective analysis of medical documentation of 84 participants with cancer who were qualified for home enteral nutrition in Nutritional Counseling Center Copernicus in Gdansk in 2009-2015 was performed. Assessment of nutritional status included body mass index, the level of total protein and albumin in blood serum, total lymphocyte count, and the Nutritional Risk Score (NRS) 2002.
Results
Patients with gastric cancer most often presented albumin deficiency in comparison with patients with esophageal cancer (p = 0.02). The low level of total lymphocyte count in 1mm3 of peripheral blood was observed in 47.6% participants. All the patients qualified for home enteral nutrition received at least 3 points in NRS 2002 and most often 5 points (40.4%).
Conclusions
All patients required nutritional treatment. Notwithstanding, the nutritional status of patients varied. Hypoalbuminemia was observed more often in patients with gastric cancer in comparison with patients with esophageal cancer.
Citation
Kaźmierczak-Siedlecka K L, Folwarski M, Jankowska B, Spychalski P, Szafrański W, Baran M, Makarewicz W, Bryl E. Assessment of nutritional status of patients with cancer who are qualified for home enteral nutrition – a retrospective analysis. Eur J Transl Clin Med. 2020;3(1):16-23Introduction
According to ESPEN, malnutrition is a condition that results from lack or insufficient consumption and absorption of macro and micronutrients and energy derived from dietary substances. It leads to impairment of physical and mental body functions, decreases the quality of life, increases the costs of treatment and risk of death [1]. Enteral nutrition is carried out using an artificially created access to the alimentary tract (feeding tube) of patients who do not cover > 60% of their need for protein and calories orally for at least one week. The reduction of food intake may be the result of the functional and structural alterations in the upper part of the alimentary tract [2]. A particular kind of nutritional intervention is home enteral nutrition (HEN), indicated for patients with a properly functioning alimentary tract who do not require hospitalization (hence postpyloric feeding in patients with gastric stasis) [3]. It was observed that 75% of people qualified for HEN suffer from malnutrition [4]. The main aims of home enteral nutrition are to improve the nutritional status, shorten hospital stay as well as to improve quality of life [2, 5-6]. The results of a study by Walewska et al. showed that application of HEN improves the parameters of nutritional status such as total lymphocyte count, transferrin and albumin concentration as well as the body mass index (BMI) [2]. According to other trials, HEN reduces the risk of malnutrition and improves the quality of life of patients who underwent esophagostomy [7-8]. An appropriate nutritional treatment is particularly significant in patients with cancer who most often suffer from malnutrition and cachexia [9]. Malnutrition is mainly observed in patients with pancreatic, gastric, esophageal, head as well as neck cancer [10]. It is estimated that 4-23% of patients die from cachexia [11]. With the use of NRS 2002 system, Sznajder et al. demonstrated that malnutrition occurs in case of 30% of patients who are admitted to a clinical oncology ward [11]. Similar results were obtained by Planas et al. who observed that upon admission to the hospital, 34% of cancer patients (various types of cancer, e.g. head, neck, pancreatic, hepatic) suffer from malnutrition, whereas at the moment of charge from the hospital, this number increases to 36% [12]. According to the another study, malnutrition is observed 52% patients with upper alimentary tract cancer [13]. The differences between the results of the above-cited studies seem to suggest that the higher the cancer is located in the alimentary tract, the faster and more frequently the protein-calorie malnutrition develops [14]. The causes of malnutrition include loss of appetite and eating disorders that are due to chronic inflammation and pain during swallowing caused by tumor growth. In case of people who suffer from alimentary tract cancers (e.g. who underwent gastric or bowel resection), malnutrition may also be caused by impaired nutrient absorption [15]. However, cancer cachexia is more complex phenomenon. Several pathomechanisms are involved in the development of cancer cachexia and cytokines/cachectic factors such as TNF-α, IL-1, IL-6, INF, STAT3 have an important part [16-17].
According to the ESPEN (European Society for Clinical Nutrition and Metabolism) guidelines, the nutritional status of patients with cancer receiving home enteral nutrition should be evaluated during the qualification for HEN with the use of anthropometric measurements (BMI and potentially body composition analysis), laboratory tests (total serum protein, albumin, prealbumin and transferrin concentration, total lymphocyte count) as well as with the use of tool, e.g. NRS 2002 (Nutritional Risk Score 2002), SGA (Subjective Global Assessment) or MUST (Malnutrition Universal Screening Tool) [5, 18-20].
The primary aim of this study is to assess the nutritional status of patients with gastric and esophageal cancer who are qualified for home enteral nutrition. An additional aim is to compare the nutritional status of patients with gastric and esophageal cancer.
Materials and methods
This is a retrospective analysis of medical documentation of patients with cancer who were qualified by the staff of the Nutrition Counseling Center Copernicus (Gdańsk, Poland) for home enteral nutrition in the years 2009-2015. The inclusion criteria: age ≥ 18 years of age, feeding tube, qualification for HEN and diagnosed cancer. The exclusion criteria were as follows: < 18 years of age, lack of feeding tube, diagnosed non-cancer disease, incomplete data. A flow diagram of the participants is presented on the Figure 1.
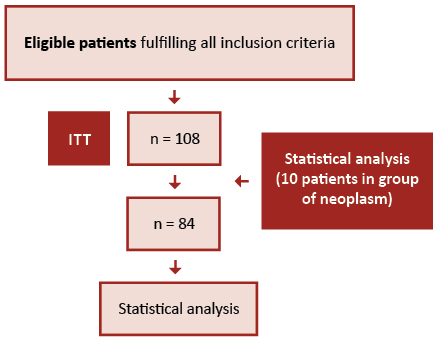
Figure 1. Participants flow diagram
The nutritional status was assessed using the BMI, level of total serum protein, albumin and the total lymphocyte count. The anthropometric and laboratory parameters as well as NRS 2002 tool were carried as part of the home enteral nutrition qualification procedure.
The patients were divided according to the type of cancer they were diagnosed with. All variables analyzed in this study were quantitative. The descriptive statistics were carried out with the use of averages, medians, standard deviations, maximum and minimum values. Only the groups of ≥ 10 patients were selected for the analysis carried out with statistical tests. The remaining patients were excluded due to insufficient number and disproportion in comparison with the statistically-tested groups. The Shapiro-Wilk test was applied to check the normality of distribution of populations subject to research. The Brown-Forsythe test was applied in order to check the homogeneity of variations of the groups compared.
Depending on the data, we used either the U Mann-Whitney test (in case of groups where there are associated ranks), Z score (to find the test probability) or the Student’s t-test (to estimate independent variance). In all cases, statistical significance was set at 0.05 and two-tailed test comparison values were calculated on the basis of an assumed null hypotheses regarding lack of differences between respective averages, variances and distributions compared. The calculations were carried out using the Statistica software, version 13.1 (Dell Inc., USA).
Results
The characteristics of study participants are presented in Table 1. After the inclusion and exclusion criteria were applied, 84 patients with gastric and esophageal cancer in the range of 48-93 years of age (median = 68 years of age) were considered. Assessment of patients with gastric cancer (53.6%) and esophageal cancer (46.4%) was distinguished. The characteristics of patients who qualified for analysis are shown in Table 2.
Table 1. Characteristisc of all participants

Table 2. Characteristics of participants with gastric and esophageal cancer
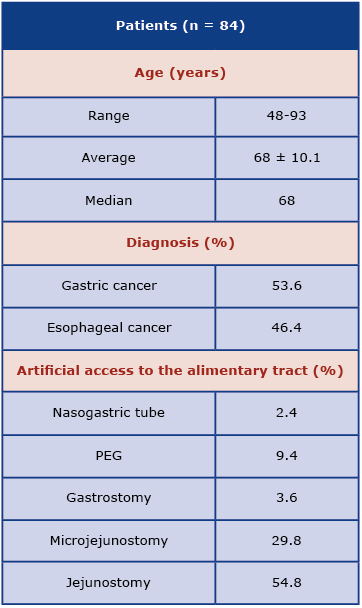
The most frequently used feeding tube was jejunostomy (54.8%) and microjejunostomy (29.8%). In case of patients with gastric cancer, the jejunostomy (64.4%) was the most frequently applied. In case of patients with esophageal cancer the jejunostomy (43.6%) and microjejunostomy (30.8%) were the most frequently applied feeding tubes.
The average value of BMI in all patients was 20.9±3.6 (median of 20.9 kg/m², min. value of 13.2 kg/m², max. value of 29 kg/m²). Among all participants, the largest groups were patients with normal BMI (48.8%, defined as 18.5-25 kg/m²) and underweight (32.2%, BMI < 18.5 kg/m²). Participants with gastric cancer most often presented normal BMI (48.9%) and underweight (26.7%). In case of people with esophageal cancer, normal BMI (48.7%) and underweight (38.5%) were observed. No statistical difference was found between patients with gastric and esophageal cancer regarding BMI the (p = 0.18). Regarding the ESPEN guidelines about patients > 70 years of age, it was noted that 26.2% of those patients have BMI < 22 kg/m².
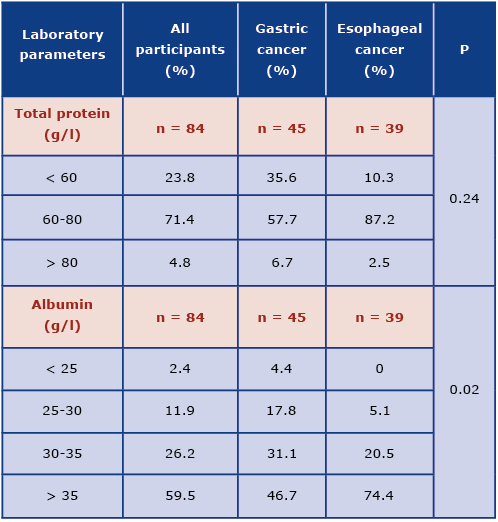
The data obtained regarding the total serum protein and albumin level was shown in Table 3. Majority of participants had normal total serum protein (71.4%) and albumin (59.5%) levels. Patients with gastric cancer more often presented protein deficiency in comparison to patients with esophageal cancer, however this was not a statistically significant difference (p = 0.24). The deficiency of albumin was observed more frequently in patients with gastric cancer and this difference was statistically significant (p = 0.02; Graph 1).
Table 3. Characteristics of patients with gastric and esophageal cancer regarding total serum protein (g/l) and serum albumin (g/l) levels

Graph 1. The comparison of albumin level in patients with esophageal and gastric cancer
The normal level of total lymphocyte count in (> 1500 in 1 mm³) was noted in 52.4% of patients with gastric and esophageal cancer (table 4). Analysis of this parameter did not show a statistically significant difference between patients with gastric and esophageal cancer (p = 0.94).
Table 4. Characteristics of patients with gastric and esophageal cancer regarding the total lymphocyte count

Among all participants, the largest group constituted patients who received 5 points in NRS 2002 tool (40.4%). Patients with gastric cancer most often received 5 points, while patients with esophageal cancer - 4 points (Table 5). It was not a statistically significant difference (p = 0.53).
Table 5. Characteristics of patients with gastric and esophageal cancer regarding the NRS 2002 system
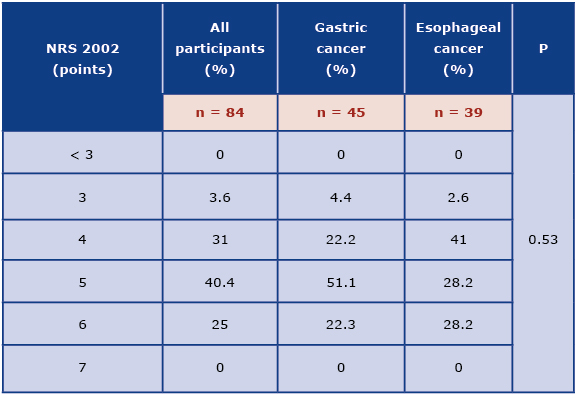
Table 6. Statistical comparison of nutritional parameters of patients with gastric and esophageal cancer
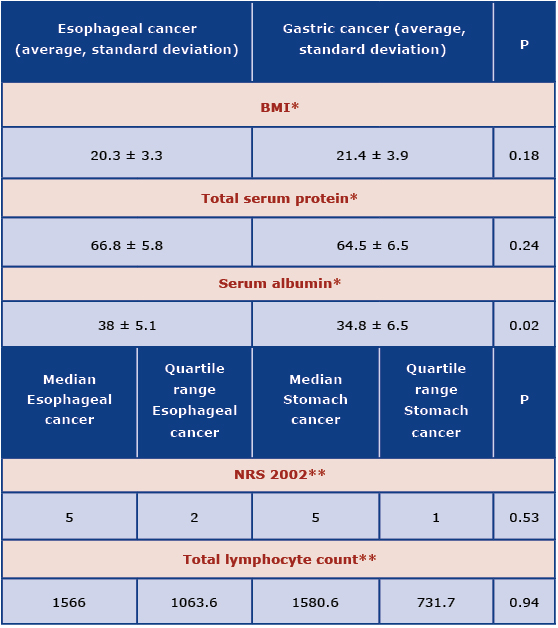
*t Student test (independent variance estimation)
**U Mann-Whitney Test
Discussion
There is a lack of data from Poland about the nutritional status of gastric and esophageal cancer patients qualified for HEN. Furthermore, there are not many studies regarding the nutritional status of patients treated using HEN. One of the limitations of our study is non-homogenous population. Moreover, this study did not include the stage of disease. The results may be different if patients with the same type of neoplasm are assessed.
Among the anthropometric measurements used in the assessment of nutritional status, BMI deserves attention. Our results were similar to those obtained by Walewska et al., who noted that BMI at the start of HEN was 19.4 ± 4.3 kg/m2 [2]. In our study we showed that malnutrition assessed on the basis of BMI was observed among 32.2% of cancer patients, whereas Bruzgielewicz et al reported 41% [21]. Anthropometric measurement is a cheap and simple method, however such measurements should only be a part of complex assessment of nutritional status. This is particularly true for patients with edema which leads to a significant increase in BMI. The gold standard is body mass composition analysis, which includes lean body mass, fat mass and total body water. In some cases, weight loss may be caused by reduction of lean body mass.
According to the GLIM Criteria for diagnosing of Stage 1 or Stage 2 malnutrition only one phenotypic and one etiologic criterion needs to be fulfilled. To assess patients regarding this criteria, unintentional weight loss during last months is necessary; however, it is a retrospective analysis of patients’ documentation that do not include this data [22]. Therefore, this is an additional limitation of this study.
The assessment of nutritional status should include laboratory tests that may be divided into biochemical (level of total protein, albumin, prealbumin and transferrin in blood serum) and immunological (total lymphocyte count) [7, 10, 13]. Similar results to ours were noted in a study by Walewska et al., where the average albumin concentration was 3.46 g/l, which indicates low malnutrition at the moment of initiation of home enteral nutrition [2]. According to Szczepanik et al., deficiency of albumin was observed in case of 17% patients who suffer from alimentary tract cancer [23]. According to own research, albumin deficiency most often occurred in patients with gastric cancer in comparison with patients with esophageal cancer. The level of serum albumin directly reflects the nutritional status of a patient. Their level is affected not only by supply of protein in diet, but also by the presence of inflammation and level of body hydration. However, albumins are proteins with long half-life period of 21 days, therefore they are not used to determine very fast changes that occur during nutritional therapy [10]. It is noteworthy that laboratory parameters are only complementary with other methods of nutritional status assessment of patients with gastric as well as esophageal cancer.
Regarding the total lymphocyte count, our results were similar to those presented by Walewska et al. study; the average total lymphocyte count at the moment of initiation of HEN was 1906/mm3, so it was normal [2]. In turn, the symptoms of malnutrition on an insignificant, moderate or severe level were observed in 34.3% of patients. Comparable results were also obtained in Szczepanik et al. trial, where the deficiency of total lymphocyte count was observed in 42.3% of patients with alimentary tract cancer [23]. According to the Bruzgielewicz et al. study, the low level of total lymphocyte count was observed in 37% of patients with laryngeal and lower throat cancer [21]. Lower level of lymphocytes is a result of lower synthesis and immunosuppression related to malnutrition. An additional limitation of our study is that we did not assess the role of lymphocytes in nutritional status because the subpopulations of T cells were not included in the methodology.
Complex assessment of nutritional status should cover standardized tool such as NRS, SGA or MUST [1]. It is known that PG-SGA (Patient Generated Subjective Global Assessment) method is one of the best to assess nutritional status, because it includes among other edemas, unintentional weight loss during last 6 months and even 2 weeks, alterations in food intake [24]. Moreover, the SGA tool is more appropriate to assess the nutritional status mainly of patients with cancer in which the malnutrition may be develop in short period [20]. The patient documentation available for our analysis contained only the NRS 2002 scores, thus it is another limitation of this study. Among all patients, the largest group was patients who received 5 points (40.5%). All patients qualified for HEN received ≥ 3 points in NRS 2002, which indicates a need for nutritional treatment.
The limitations of our retrospective study present the lack of appropriate assessment of nutritional status of patients with cancer in clinical practice in Poland. The body composition analysis should be performed and the unintentional weight loss during last months should be noted, therefore the role of clinical nutritionist should also be taken into consideration.
Conclusions
The assessment of patients’ nutritional status during qualification for home enteral nutrition is required to identify patients at risk of malnutrition or malnourished. It is necessary to introduce an appropriate nutritional treatment and prevent the consequence of malnutrition. In the present study, the nutritional status of patients qualified for HEN varied. Most patients were characterized by normal BMI, normal total serum protein and albumin level as well as normal total lymphocyte count. Hypoalbuminemia was observed more often in patients with gastric cancer in comparison with patients with esophageal cancer. All patients required nutritional treatment.
The authors have no conflicts of interest to declare.
References
| 1. |
Arends J, Bachmann P, Baracos V, Barthelemy N, Bertz H, Bozzetti F, et al. ESPEN guidelines on nutrition in cancer patients. Clin Nutr [Internet]. 2017;36(1):11–48. Available from: https://doi.org/10.1016/j.clnu.2016.07.015.
|
| 2. |
Walewska E, Sumlet M, Ścisło L, Kłęk S, Szczepanik AM, Czupryna A. Nutritional status of patients receiving home enteral nutrition. Pielęgniarstwo Chir i Angiol Vasc Nurs [Internet]. 2011;(2):60–9. Available from: https://www.termedia.pl/Nutritional-status-of-patients-receiving-home-enteral-nutrition,50,16755,0,1.html.
|
| 3. |
Gramlich L, Hurt R, Jin J, Mundi M. Home enteral nutrition: towards a standard of care. Nutrients [Internet]. 2018 Aug 4;10(8):1020. Available from: https://doi.org/10.3390/nu10081020.
|
| 4. |
Villar Taibo R, Martínez Olmos M-Á, Bellido Guerrero D, Vidal Casariego A, Peinó García R, Martís Sueiro A, et al. Epidemiology of home enteral nutrition: an approximation to reality. Nutr Hosp [Internet]. 2018 May 7;35(3):511–8. Available from: http://revista.nutricionhospitalaria.net/index.php/nh/article/view/1799.
|
| 5. |
Gavazzi C, Colatruglio S, Valoriani F, Mazzaferro V, Sabbatini A, Biffi R, et al. Impact of home enteral nutrition in malnourished patients with upper gastrointestinal cancer: A multicentre randomised clinical trial. Eur J Cancer [Internet]. 2016 Sep;64:107–12. Available from: https://linkinghub.elsevier.com/retrieve/pii/S0959804916321992.
|
| 6. |
Lee JLC, Leong LP, Lim SL. Nutrition intervention approaches to reduce malnutrition in oncology patients: a systematic review. Support Care Cancer [Internet]. 2016;24(1):469–80. Available from: https://doi.org/10.1007/s00520-015-2958-4.
|
| 7. |
Wu Z, Wu M, Wang Q, Zhan T, Wang L, Pan S, et al. Home enteral nutrition after minimally invasive esophagectomy can improve quality of life and reduce the risk of malnutrition. Asia Pac J Clin Nutr [Internet]. 2018;27(1):129. Available from: https://search.informit.com.au/documentSummary;dn=288244823399816;res=IELAPA.
|
| 8. |
Zeng J, Hu J, Chen Q, Feng J. Home enteral nutrition’s effects on nutritional status and quality of life after esophagectomy. Asia Pac J Clin Nutr [Internet]. 2017;26(5):804. Available from: https://search.informit.com.au/documentSummary;dn=017507751018170;res=IELIAC.
|
| 9. |
Kłęk S, Jankowski M, Kruszewski WJ, Fijuth J, Kapała A, Kabata P, et al. Clinical nutrition in oncology: Polish recommendations. Oncol Clin Pract [Internet]. 2015;11(4):173–90. Available from: https://journals.viamedica.pl/oncology_in_clinical_practice/article/view/43103.
|
| 10. |
Kwella B, Urbanowicz K. Kwalifikacja do domowego leczenia żywieniowego chorych z rozpoznaniem choroby nowotworowej. Postępy Żywienia Klin. 2017;13:49–55.
|
| 11. |
Sznajder J, Ślefarska-Wasilewska M. Ocena stanu odżywienia pacjentów przyjmowanych do Oddziału Onkologii Klinicznej przy użyciu powszechnie używanych skal: NRS2002 i SGA. Postępy Żywienia Klin Clin Nutr. 2014;10(4):15–7.
|
| 12. |
Planas M, Álvarez-Hernández J, León-Sanz M, Celaya-Pérez S, Araujo K, De Lorenzo AG. Prevalence of hospital malnutrition in cancer patients: a sub-analysis of the PREDyCES® study. Support Care Cancer [Internet]. 2016;24(1):429–35. Available from: https://doi.org/10.1007/s00520-015-2813-7.
|
| 13. |
Attar A, Malka D, Sabaté JM, Bonnetain F, Lecomte T, Aparicio T, et al. Malnutrition Is high and underestimated during chemotherapy in gastrointestinal cancer: an AGEO prospective cross-sectional multicenter study. Nutr Cancer [Internet]. 2012 May 1;64(4):535–42. Available from: https://doi.org/10.1080/01635581.2012.670743.
|
| 14. |
Szczygieł B. Niedożywienie u chorych na raka przełyku: występowanie, przyczyny, następstwa, rozpoznanie, leczenie. Nowotwory J Oncol [Internet]. 2010;60(5):436. Available from: https://journals.viamedica.pl/nowotwory_journal_of_oncology/article/download/52171/38904.
|
| 15. |
Tokajuk A, Car H, Wojtukiewicz M. Problem niedożywienia u chorych na nowotwory. Med Paliatywna w Prakt [Internet]. 2015;9(1):23–9. Available from: https://journals.viamedica.pl/palliative_medicine_in_practice /article/download/43708/30039.
|
| 16. |
Donohoe CL, Ryan AM, Reynolds J V. Cancer cachexia: mechanisms and clinical implications. Gastroenterol Res Pract [Internet]. 2011;1–13. Available from: https://doi.org/10.1155/2011/601434.
|
| 17. |
Aoyagi T, Terracina KP, Raza A, Matsubara H, Takabe K. Cancer cachexia, mechanism and treatment. World J Gastrointest Oncol [Internet]. 2015;7(4):17–29. Available from: http://www.wjgnet.com/1948-5204/full/v7/i4/17.htm.
|
| 18. |
Fizia K, Gętek M, Czech N, MUuc-Wierzgoń M, Nowakowska-Zajdel EWA. Metody oceny stanu odżywienia u chorych na nowotwory. Pielęgniarstwo Pol [Internet]. 2013;105. Available from: pielegniarstwo.ump.edu.pl/uploads/2013/2/2_48_2013.pdf#page=39.
|
| 19. |
Prevost V, Joubert C, Heutte N, Babin E. Assessment of nutritional status and quality of life in patients treated for head and neck cancer. Eur Ann Otorhinolaryngol Head Neck Dis [Internet]. 2014;131(2):113–20. Available from: https://doi.org/10.1016/j.anorl.2013.06.007.
|
| 20. |
Stasik Z, Skotnicki P, Jakubowicz J, Brandys K, Kulpa JK. Biochemiczne wskaźniki niedożywienia u chorych na nowotwory. J Lab Diagn [Internet]. 2009;45(1):91. Available from: http://diagnostykalaboratoryjna.eu/journal/DL_1-2009._str_91-95.pdf.
|
| 21. |
Bruzgielewicz A, Hamera M, Osuch-Wójcikiewicz E. Nutritional status of patients with cancer of larynx and hypopharyx. Otolaryngol Pol Polish Otolaryngol [Internet]. 2009;63(2):141–6. Available from: https://europepmc.org/article/med/19681485.
|
| 22. |
Cederholm T, Jensen GL, Correia MITD, Gonzalez MC, Fukushima R, Higashiguchi T, et al. GLIM criteria for the diagnosis of malnutrition–A consensus report from the global clinical nutrition community. J Cachexia Sarcopenia Muscle [Internet]. 2019;10(1):207–17. Available from: https://doi.org/10.1002/jcsm.12383.
|
| 23. |
Szczepanik AM, Walewska E, Ścisło L, Kózka M, Kłęk S, Czupryna A, et al. Ocena występowania niedożywienia u chorych z nowotworami złośliwymi przewodu pokarmowego. Probl Pielęgniarstwa [Internet]. 2010;18(4):384–92. Available from: https://pdfs.semanticscholar.org/6f30/4773bf9b4958f4e1ca27404077805dd53bcd.pdf.
|
| 24. |
Ottery FD. Definition of standardized nutritional assessment and interventional pathways in oncology. Nutrition [Internet]. 1996;12(1):S15–9. Available from: https://doi.org/10.1016/0899-9007(95)00067-4.
|
